
The Key Level indicator for Metatrader 4 automatically detects important price zones where the market is likely to react.
These areas often act as support or resistance, making them valuable locations for planning entries, exits, stop-loss placement, and profit targets.
Rather than manually drawing horizontal levels, this tool continuously scans the chart and highlights zones where significant buying or selling interest has previously occurred.
One of its biggest strengths is its multi-timeframe analysis.
Instead of focusing on a single chart, it identifies levels that remain relevant across multiple timeframes.
This allows Forex participants to build trading plans around areas that have greater technical significance and are more likely to influence future price action.
Why traders use the Key Level tool
Support and resistance form the foundation of many successful trading strategies.
Markets regularly pause, reverse, or accelerate around these levels because buyers and sellers often place orders in the same areas.
This tool automatically identifies those zones, saving valuable chart analysis time while helping users focus on the highest-probability setups.
Another advantage is its clean presentation.
Only the most meaningful levels are displayed, leaving enough room for candlestick analysis, trend lines, moving averages, or other technical tools.
Since the levels are based on multi-timeframe price behavior, they often remain important even when switching between higher and lower charts.
Download This MT4 Indicator for Free
Indicator Chart Setup
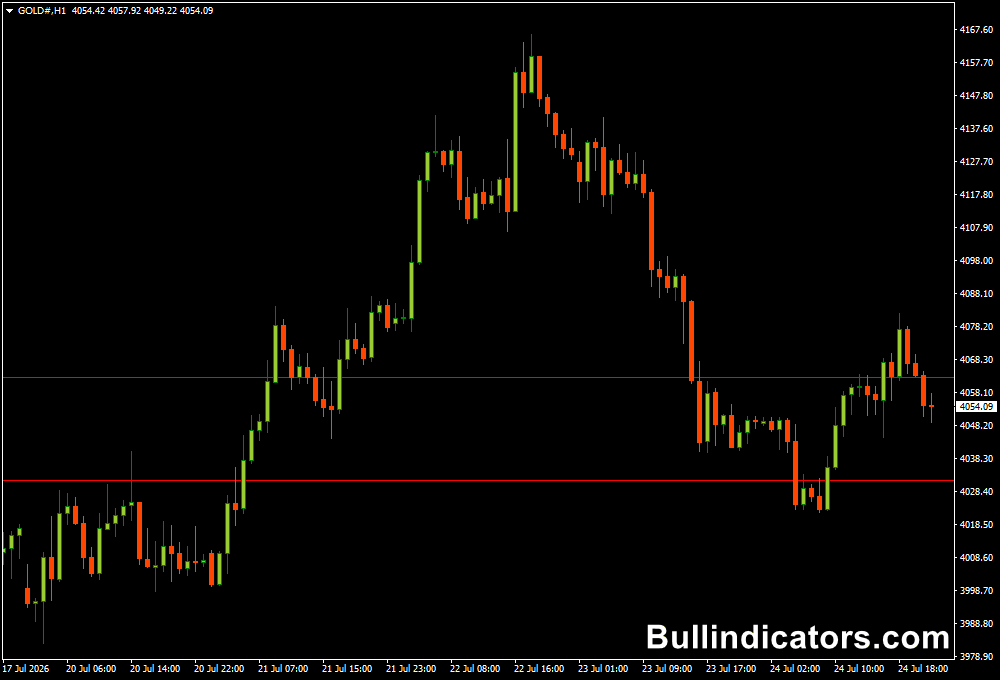
After attaching the Key Level tool to a Metatrader 4 chart, horizontal support and resistance zones appear automatically.
These levels represent areas where price previously experienced strong rejection or consolidation.
As the market approaches one of these zones again, it becomes a location to monitor for reversals, breakouts, or continuation patterns.
Many experienced Forex users first identify the important level on H1 or H4 before switching to lower timeframes such as M5 or M15 to look for precise entry signals using candlestick patterns or price action confirmation.
Core Features
- Automatically detects significant support and resistance zones.
- Uses multi-timeframe price analysis.
- Highlights potential reversal and breakout areas.
- Keeps charts clean and easy to read.
- Suitable for manual and price action trading.
- Works on all major financial instruments.
- Requires no manual drawing of horizontal levels.
Best for
- Support and resistance trading.
- Price action strategies.
- Breakout confirmation.
- Reversal trading.
- Trend continuation setups.
- Planning stop-loss and take-profit levels.
Best Markets
- EUR/USD during active London sessions.
- GBP/USD around major daily levels.
- AUD/USD during Asian session reversals.
- Gold (XAUUSD) near institutional support and resistance.
- DAX and NASDAQ during market opens.
- Highly liquid Forex pairs with consistent volume.
Trading Styles
- M5 price action scalping from key rejection zones.
- M15 breakout trading after level confirmation.
- H1 intraday trading using higher-timeframe levels.
- H4 swing trading around major market turning points.
- Multi-timeframe analysis for precise trade entries.
- Support and resistance confluence strategies.
How traders use it
A common approach is to wait until price reaches one of the highlighted zones before looking for confirmation.
Bullish rejection candles near support may signal a buying opportunity, while bearish rejection at resistance can indicate a potential short position.
Since these levels are identified before price reaches them, they help prepare trading decisions in advance instead of reacting after the move has already started.
Another effective method combines higher and lower timeframes.
A significant level identified on H4 or H1 can be used as the primary decision area, while M5 or M15 charts provide precise entries after a clear rejection or breakout.
This combination helps improve risk-to-reward ratios while maintaining alignment with the broader market structure.
Get Instant Free Access
Indicator Settings
- Bam: Controls the sensitivity used when detecting significant price levels.
- Length: Determines how much historical price data is used to calculate each key level.
- Colors: Allows customization of the displayed support and resistance levels.
Important Notes
- Higher-timeframe levels generally carry more technical significance.
- Wait for price action confirmation before entering a position.
- Combine with candlestick patterns or momentum analysis for stronger setups.
- Excellent for identifying low-risk entry and exit zones.
- Works well on M5 for scalping and H1-H4 for day and swing trading.
- Breakouts accompanied by strong volume often produce more reliable signals.
- Always apply sound money management, even at strong support and resistance areas.









