
Renko Charts Indicator for MT4
The Renko Charts indicator for Metatrader 4 transforms traditional price charts into Renko bricks, allowing traders to focus on meaningful price movements rather than small market fluctuations.
Unlike standard candlestick charts that are based on time intervals, Renko charts create new bricks only when price moves a predefined distance.
This approach removes much of the market noise and helps traders identify clearer trends, important support and resistance zones, and potential reversal points.
The indicator is widely used by trend-following traders who prefer a cleaner view of price action.
The Renko Charts Indicator works across different trading styles, including scalping, intraday trading, and swing trading.
It can be combined with technical tools such as moving averages, oscillators, and support and resistance methods to create a complete trading strategy.
Why traders use the Renko Charts Indicator
Traditional candlestick charts can sometimes create confusion because small price movements produce many candles without a meaningful change in market direction.
Renko charts solve this problem by focusing only on price movement.
The indicator displays bullish and bearish bricks using different colors, making it easier to recognize momentum shifts.
A sequence of bullish bricks indicates increasing buying pressure, while bearish bricks show stronger selling activity.
Many traders use Renko charts because they simplify trend analysis.
Instead of reacting to every small candle movement, traders can focus on larger price structures and wait for stronger confirmation before entering a position.
The indicator is also useful for multi-timeframe analysis.
For example, a trader can identify the overall trend on H4 and then use a lower timeframe Renko setup for more precise entries.
Download This MT4 Indicator for Free
Indicator Chart Setup
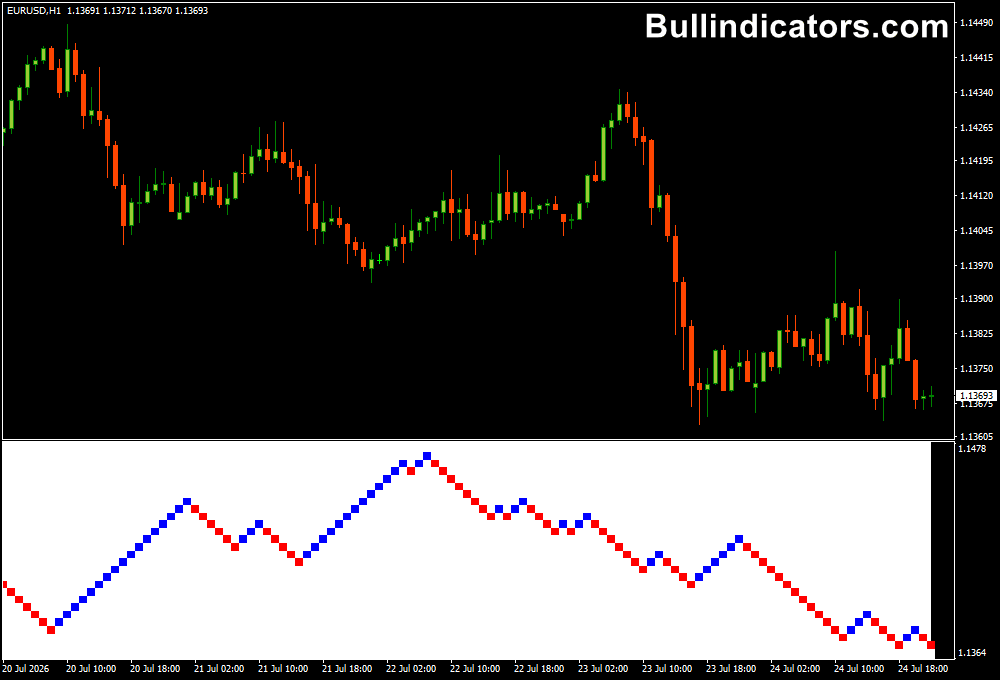
The Renko Charts Indicator creates a separate Renko-based price display instead of traditional candlesticks.
The chart consists of brick formations that appear when price moves by the selected brick size.
Bullish bricks are displayed in blue, while bearish bricks appear in red. A new brick is created only after price travels the required pip distance defined in the settings.
For example, if the brick size is set to 10 pips, the market must move 10 pips before a new Renko brick is formed.
This allows traders to filter smaller fluctuations and focus on stronger directional movements.
Core Features
- Converts price movement into Renko bricks.
- Filters unnecessary market noise.
- Displays bullish and bearish trends visually.
- Helps identify support and resistance areas.
- Works with scalping, intraday, and swing strategies.
- Customizable Renko brick size.
- Compatible with different Forex instruments and timeframes.
Best for
- Trend identification.
- Momentum trading strategies.
- Support and resistance analysis.
- Breakout trading setups.
- Reducing emotional trading decisions.
- Price action-based strategies.
Best Markets
- EUR/USD and GBP/USD for clean directional trends.
- USD/JPY during strong momentum sessions.
- Gold (XAU/USD) when large price movements occur.
- US indices such as NASDAQ and US30.
- Crude Oil during high volatility periods.
- Major Forex pairs during London and New York sessions.
Trading Styles
- M1 and M5 scalping with smaller brick sizes.
- M15 momentum trading.
- H1 intraday trend following.
- H4 swing trading setups.
- Daily and weekly market analysis.
- Breakout and trend continuation strategies.
How traders use it
The Renko Charts Indicator is mainly used to follow established trends and identify possible changes in market direction.
A common strategy is to wait for several bricks to form in the same direction before entering a trade.
This avoids reacting too quickly to a single brick change.
Example BUY setup:
- Blue Renko bricks begin forming after a bearish phase.
- The trader waits for confirmation with two or three consecutive bullish bricks.
- A BUY position is opened after the trend direction becomes clear.
- The stop loss is placed below the previous Renko support area.
- The trade is managed until bearish bricks appear or a target level is reached.
Example SELL setup:
- Red Renko bricks appear after an upward movement.
- The trader confirms that selling pressure is increasing.
- A SELL position is opened with a stop loss above the recent Renko resistance area.
- The position is maintained while bearish bricks continue.
For better accuracy, many traders combine Renko charts with trend indicators.
For example, a moving average can define the main direction while Renko bricks provide the entry timing.
Get Instant Free Access
Indicator Settings
- Porog: Determines the Renko brick size. A higher value creates larger bricks and filters more price movement.
- Colors: Allows customization of bullish and bearish Renko brick colors.
Important Notes
- Renko charts do not use time as the main calculation factor.
- Different brick sizes may perform differently depending on market volatility.
- Smaller bricks provide more signals but may create additional false movements.
- Larger bricks provide cleaner trends but fewer trading opportunities.
- Some traditional indicators may behave differently when used with Renko charts.
- Always combine Renko signals with proper risk management.
- Testing different settings for each market can improve results.









