
The Daily Pivot Points indicator for MT4 is a practical support and resistance tool that automatically calculates important price levels using the previous trading session’s high, low, and close.
These levels help identify potential reversal zones, breakout areas, and logical locations for stop-loss and take-profit placement.
Because the calculations are objective, every market participant using the same formula will see identical pivot levels.
This makes daily pivot points one of the most respected technical tools for short-term market analysis.
Whether you focus on intraday price movements or look for precise entry locations, this tool provides a structured framework for reading market behavior.
Why traders use the Daily Pivot Points Indicator
Support and resistance play an important role in technical analysis, but drawing these levels manually often produces different results.
The Daily Pivot Points Indicator removes this uncertainty by calculating all key levels automatically from the previous trading day’s data.
The central Pivot Point (PP) acts as the primary reference level, while the resistance zones (R1, R2, and R3) and support zones (S1, S2, and S3) highlight areas where buying or selling pressure may increase.
Intermediate levels between the main zones offer additional price references during volatile sessions.
Many market participants use these levels to prepare trading plans before the London or New York session begins, allowing them to react quickly as price approaches important areas.
Download This MT4 Indicator for Free
Indicator Chart Setup
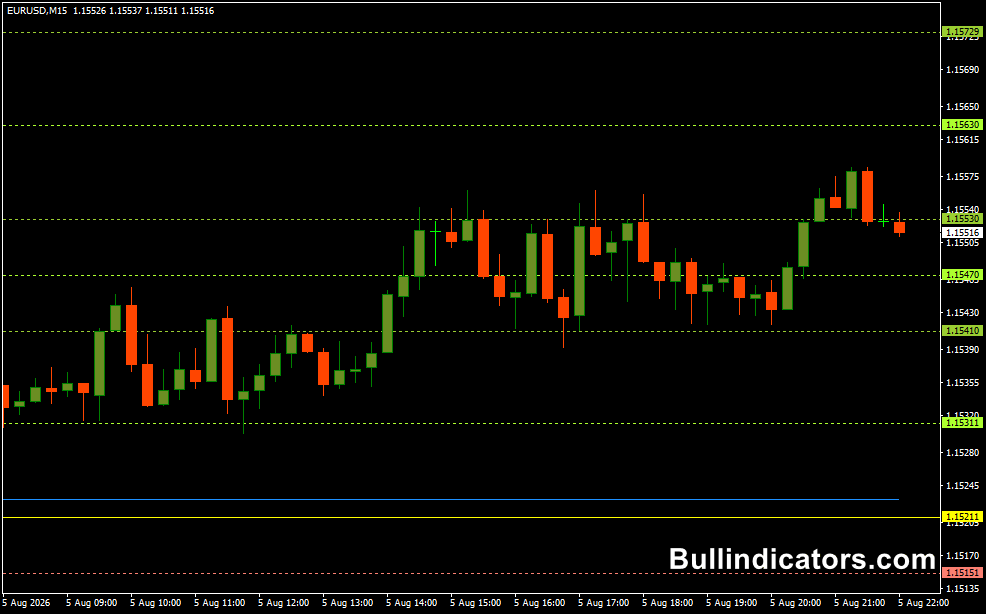
The chart displays a complete set of horizontal pivot levels across the current trading day.
The yellow Pivot Point (PP) is positioned between the support and resistance zones.
Above it are the resistance levels R1, R2, and R3, while S1, S2, and S3 appear below.
Additional midpoint levels provide extra price references between the major zones, giving a more detailed view of potential reaction areas.
Core Features
- Automatically calculates daily pivot levels.
- Displays Pivot Point (PP), R1-R3, and S1-S3.
- Includes intermediate support and resistance levels.
- Provides objective price levels using mathematical formulas.
- Useful for identifying reversals and breakout zones.
- Can be combined with price action and momentum tools.
Best for
- Finding high-probability support and resistance zones.
- Planning intraday entries before the trading session begins.
- Locating logical stop-loss and profit targets.
- Trading daily market reversals.
- Confirming breakout opportunities.
Best Markets
- EUR/USD during the London trading session.
- GBP/USD for active intraday price swings.
- USD/JPY during Asian and London overlap.
- Gold (XAU/USD) for momentum-based reversals.
- Major stock indices with strong daily volatility.
- Highly liquid CFDs with consistent trading volume.
Trading Styles
- Day trading.
- Scalping around key price levels.
- Breakout trading.
- Range trading.
- Price action trading.
- Session-based trading.
How traders use it
Many traders monitor price as it approaches one of the calculated pivot levels.
When bullish candlestick formations develop near S1 or S2, they may look for buying opportunities with targets near the Pivot Point or higher resistance levels.
When price reaches R1, R2, or R3 and selling pressure begins to appear, these levels often become potential areas for short positions.
If price breaks above resistance or below support with strong momentum and increased volume, many traders view this as confirmation of a breakout and follow the new direction.
The pivot levels also provide practical locations for risk management.
Stop-loss orders are frequently positioned beyond the next support or resistance level, while profit targets can be aligned with the following pivot zone.
Get Instant Free Access
Indicator Settings
- Show or hide Pivot Point (PP).
- Display resistance levels (R1, R2, R3).
- Display support levels (S1, S2, S3).
- Enable intermediate pivot levels.
- Customize line colors and styles.
- Adjust label visibility.
- Modify line thickness for better chart visibility.
Important Notes
- Calculations use the previous trading session’s high, low, and close.
- Pivot levels update each trading day automatically.
- The tool performs best during active market sessions.
- Combine pivot levels with candlestick confirmation for stronger trade setups.
- Breakouts above resistance or below support often signal increasing momentum.
- Risk management remains essential even when pivot levels produce strong reactions.
- Works well alongside momentum tools such as RSI or MACD for additional confirmation.
- Need support and resistance indicator for MT5? Click here.









