
The Gann Signal Indicator for MT5 brings the principles of Gann analysis to the trading chart through simple buy and sell arrows.
Gann Angles, associated with W.D. Gann, are traditionally used to study the relationship between price, time and market trends.
They can also help identify potential support and resistance areas.
Drawing and interpreting Gann Angles manually requires considerable precision.
This indicator simplifies that process by converting its calculations into visual signals.
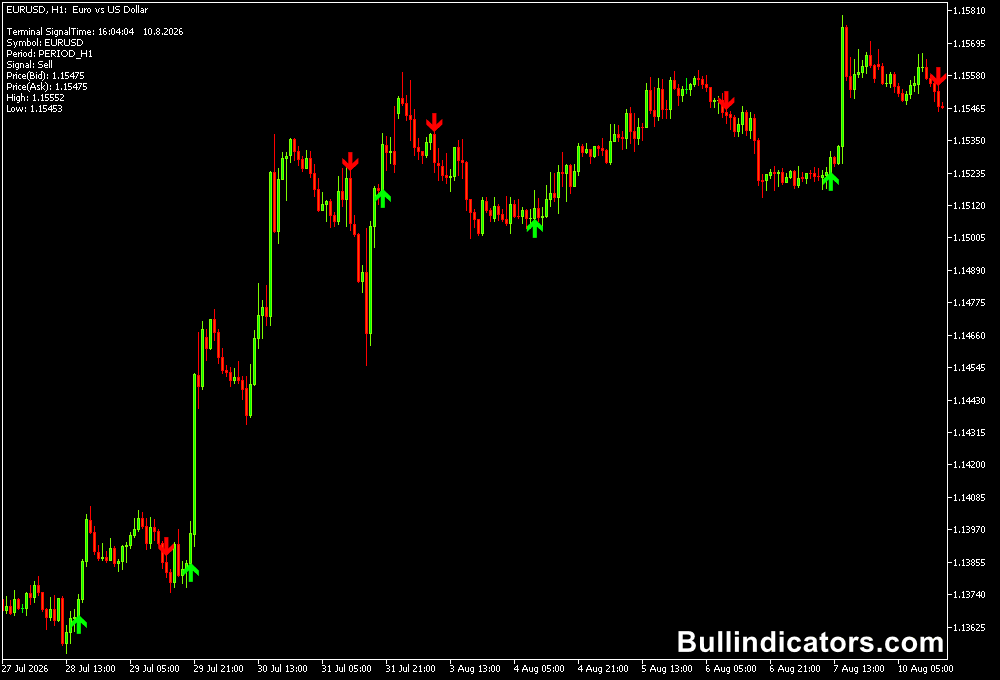
Green arrows indicate potential bullish opportunities, while red arrows point toward bearish conditions, giving you a practical way to incorporate Gann-based analysis into a trading strategy.
Why traders use the Gann Signal Indicator
The main advantage of the Gann Signal Indicator is its straightforward presentation.
There is no need to manually construct multiple Gann lines or spend time measuring price and time relationships.
The indicator produces directional arrows directly on the chart, allowing the focus to remain on price behavior and market conditions.
It can be applied across a wide range of timeframes, from M1 through D1, making it suitable for both short-term and longer-term approaches.
The signals become more useful when they agree with the prevailing trend or occur around important support and resistance levels.
Download This MT5 Indicator for Free
Indicator Chart Setup
The Gann Signal Indicator places directional arrows on the price chart when its calculations identify a potential trading opportunity.
A green arrow points to a bullish signal, while a red arrow indicates bearish pressure.
The location of an arrow is important, as signals that appear near meaningful support, resistance or a trend transition can offer more interesting setups.
The indicator can be used on different chart periods, allowing the same signal concept to be adapted for scalping, intraday trading or broader trend analysis.
Core Features
- Uses principles associated with Gann Angle analysis.
- Green arrows identify potential bullish signals.
- Red arrows identify potential bearish signals.
- Works across timeframes from M1 to D1.
- Adjustable calculation period.
- Optional trading comments and sound notifications.
- Useful as a directional tool alongside trend analysis.
Best for
- Identifying potential trend changes and directional entries.
- Finding reversal opportunities near important price levels.
- Confirming breakout or continuation setups.
- Adding a simple visual signal to a price-action strategy.
- Filtering entries according to the broader market trend.
Best Markets
- EURUSD: Suitable for intraday trend and reversal setups on M15 and H1.
- GBPUSD: Useful around major support and resistance during active sessions.
- USDJPY: Well suited to directional moves on M15, H1 and H4.
- GBPCHF: Can be monitored for larger swings where directional movement develops.
- XAUUSD: Useful for studying reversal and continuation signals on M15 and H1, with volatility taken into account.
Trading Styles
- Scalping: M1 and M5 charts can provide frequent arrow signals, although additional filtering is important.
- Intraday trading: M15 and H1 offer a practical setting for combining signals with market structure.
- Swing trading: H4 and D1 signals can be used to identify broader directional opportunities.
- Reversal trading: Focus on arrows appearing close to established support or resistance.
- Trend following: Take signals that agree with the direction established on a higher timeframe.
How traders use it
The basic method is simple: wait for an arrow and then assess whether the signal agrees with the current market direction.
A green arrow can support a buy setup, while a red arrow can support a short position.
The strongest opportunities generally occur when the signal has additional technical confirmation.
Trading Example
A green arrow during an established uptrend can provide a potential continuation entry after a pullback.
A red arrow appearing near resistance during a bearish market can offer a possible short setup.
Signals that oppose a strong trend require more caution because a temporary retracement can produce an early reversal signal.
Support and resistance are particularly useful when evaluating the arrows.
A bearish signal near resistance has a different context from a bearish signal that appears in the middle of a strong bullish move.
Likewise, a green arrow near established support can carry more significance than one appearing inside a sideways range.
Stop-loss placement can be based on the most recent swing high or low, while profit targets can be positioned around the next significant support or resistance area.
The approach can also use a higher timeframe to establish direction before taking an entry on a faster chart.
Get Instant Free Access
Indicator Settings
- Periods: Determines the number of bars used in creating the indicator calculations. Changing this value can affect the frequency and responsiveness of signals.
- Comments: Allows trading comments to be displayed on the chart.
- Sound: Enables or disables sound notifications when signals are generated.
Important Notes
- A green arrow does not guarantee that price will continue higher, and a red arrow does not guarantee a decline.
- Signals should be evaluated in the context of the prevailing trend and nearby price levels.
- Range-bound markets can produce weaker reversal signals.
- Higher-timeframe confirmation can help filter countertrend entries on lower charts.
- Use appropriate stop-loss placement and position sizing for the volatility of the selected market.









