The LuxAlgo Liquidity Swings indicator for MT5 highlights important swing highs and lows where liquidity may accumulate.
These areas can attract price as pending orders, stop-losses, and breakout orders become relevant around previous turning points.
By marking liquidity zones and displaying volume labels, the indicator helps identify areas where price may encounter rejection, accelerate through a level, or change direction.
Unlike conventional support and resistance indicators, this tool focuses on liquidity around market swings.
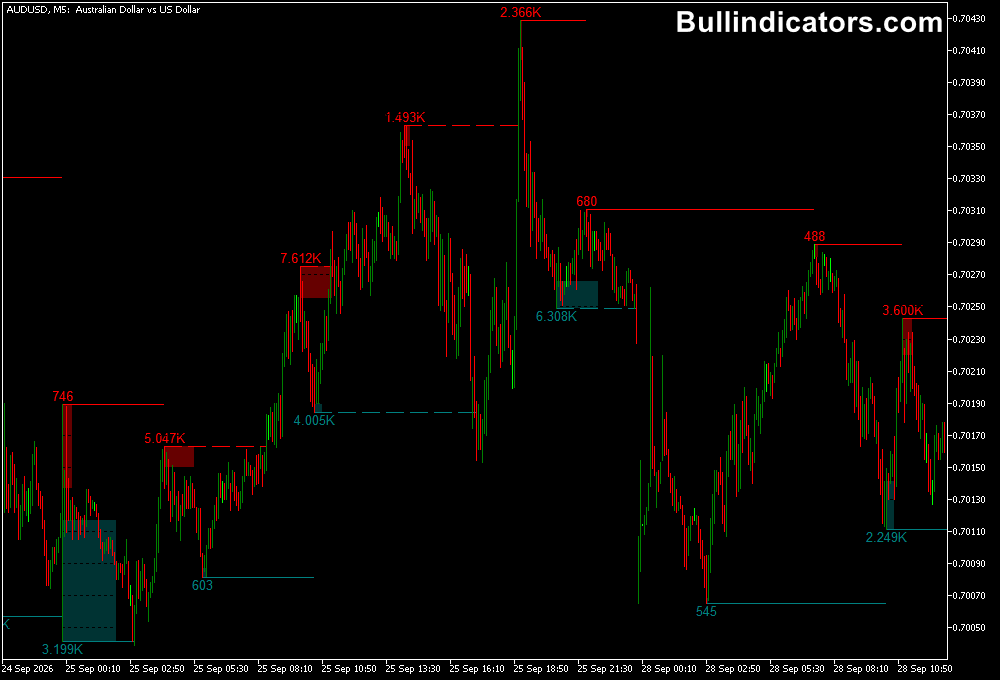
Teal and red zones distinguish different areas of interest, while numeric labels help compare the relative significance of detected swings.
The indicator does not generate conventional buy or sell arrows, so its main purpose is to provide market context for a structured trading strategy.
H1 and H4 charts are particularly useful for identifying major liquidity levels before looking for a confirmed entry.
Why traders use the LuxAlgo Liquidity Swings Indicator
Previous highs and lows often attract attention because breakout orders and protective stop-losses can accumulate around them.
When price approaches these levels, a liquidity sweep may be followed by a reversal, while a decisive breakout can lead to further directional movement.
The indicator makes these areas easier to locate and compare.
Volume labels help distinguish larger reported swings from less prominent ones, while configurable filters allow the displayed zones to focus on selected counts or volume percentages.
This provides a useful foundation for analysing market structure, planning trade locations, and avoiding entries directly into nearby liquidity zones.
Download This MT5 Indicator for Free
Indicator Chart Setup
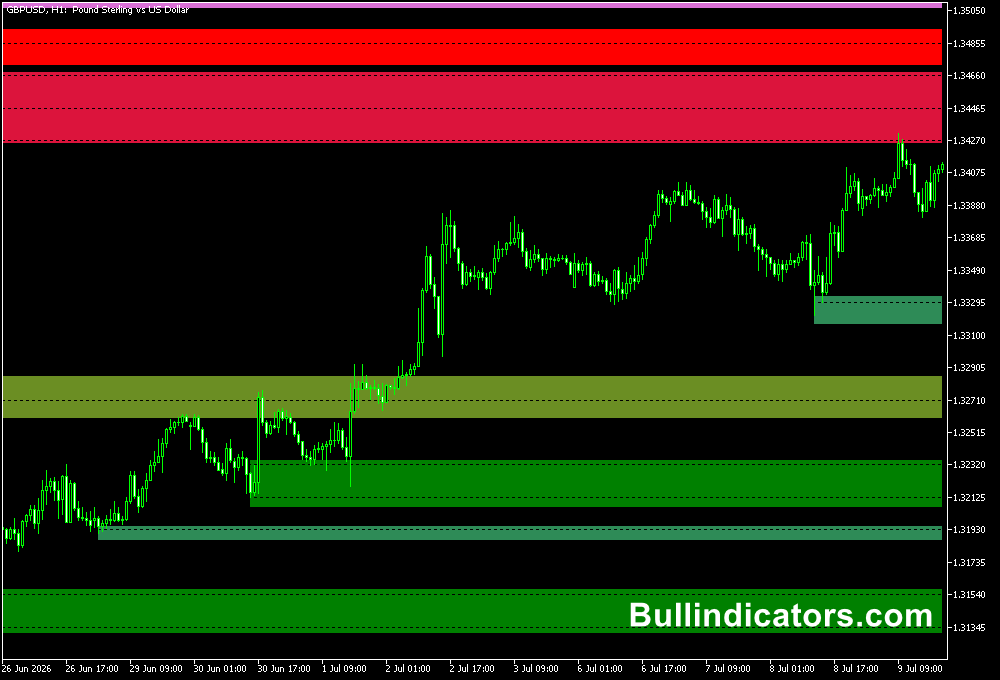
The indicator draws coloured liquidity areas around confirmed swing points.
Teal zones and labels mark one category of liquidity, while red zones and labels identify the opposite category.
The precise placement depends on the indicator’s calculation and selected swing-area settings. Numeric volume labels provide additional information about the detected swings.
On H1 and H4 charts, these zones can reveal important levels that are less obvious on lower timeframes.
A previous high may become a potential target for a bullish move, while a previous low may attract price during a decline.
If price briefly crosses one of these levels and then closes back within the previous range, the move may represent a liquidity sweep.
Confirmation from subsequent candles is important because not every sweep produces a reversal.
Core Features
- Automatic detection of significant swing highs and lows.
- Visual liquidity zones displayed using contrasting colours.
- Numeric volume labels for comparing detected swings.
- Adjustable pivot confirmation through the lookback setting.
- Options for defining liquidity areas using candle wicks or bodies.
- Intrabar timeframe selection for more detailed analysis.
- Filters to control displayed zones by count or volume percentage.
Best for
- Identifying potential liquidity sweeps above previous highs and below previous lows.
- Mapping higher-timeframe areas that may attract price during a retracement.
- Assessing breakout attempts and possible false breakouts.
- Finding potential reversal locations when combined with market structure and price confirmation.
- Planning profit targets around significant opposing liquidity zones.
Best Markets
- EURUSD: Useful for identifying major swing levels and liquidity targets on H1 and H4 charts.
- GBPUSD: Suitable for analysing stop runs and breakouts around established highs and lows.
- USDJPY: Helps map swing levels during sustained directional movements and pullbacks.
- Gold (XAUUSD): Worth testing for liquidity sweeps around prominent highs and lows, with careful attention to volatility.
- US indices: Can be used to study swing liquidity on supported index instruments, depending on broker availability and trading conditions.
Trading Styles
- H1 intraday trading: Identify nearby liquidity zones and use M15 or M5 price action to confirm potential entries.
- H4 swing trading: Map major swing levels and wait for a sweep, rejection, or confirmed breakout before entering.
- Breakout trading: Monitor price acceptance beyond a significant liquidity zone rather than relying on a brief penetration.
- Reversal trading: Look for a failed breakout followed by a strong candle close back inside the previous range.
How traders use it
Start with the H4 chart and identify the most prominent liquidity zones around recent swing highs and lows.
Note whether price is approaching one of these areas from a sustained trend or moving within a range.
Then switch to H1 to examine the latest price action and determine whether the level is holding, being swept, or breaking decisively.
For a potential reversal, wait for price to move beyond a marked swing level and then close back inside the previous range.
Look for a subsequent break of short-term market structure in the opposite direction before considering an entry.
For a breakout setup, look for a decisive close beyond the zone and evidence that price is holding outside it.
A stop-loss can be placed beyond the sweep extreme or another technically relevant level, with the distance adjusted to current volatility.
Example H4 and H1 Liquidity Sweep Strategy
This strategy combines higher-timeframe liquidity mapping with lower-timeframe confirmation. It is a setup to test, not a guaranteed trading signal.
- Step 1 — Mark the levels: On H4, identify a prominent swing high and swing low with clearly displayed liquidity zones.
- Step 2 — Wait for a sweep: On H1, watch for price to trade beyond one of those levels and then close back inside the previous range.
- Step 3 — Confirm direction: For a potential buy, look for bullish displacement or a break above a recent H1 lower high. For a potential sell, look for bearish displacement or a break below a recent H1 higher low.
- Step 4 — Plan the entry: Consider an entry after confirmation or on a subsequent pullback, provided the setup remains valid.
- Step 5 — Manage the risk: Place the stop beyond the sweep extreme or an appropriate structural level. Consider the next opposing liquidity zone as a potential target.
- Step 6 — Check the reward: Only take a setup when the potential reward justifies the risk and the target leaves sufficient room for the trade to develop.
Get Instant Free Access
Indicator Settings
- Pivot Lookback: Determines how many candles on either side are used to confirm a swing high or low. Higher values generally identify larger, less frequent swings and may introduce additional confirmation delay.
- Swing Area: Defines how the liquidity zone is drawn, such as using candle wicks or candle-body extremes.
- Intrabar Precision TF: Selects the timeframe used for intrabar analysis. A lower timeframe may provide more granular information but can require additional historical data.
- Filter Areas By: Filters the displayed liquidity zones according to the available count or volume-percentage criteria.
- Colors: Adjusts the visual colours of the liquidity zones and labels where supported by the indicator inputs.
Important Notes
- Liquidity zones indicate areas of potential market interest; they do not reveal the exact location of institutional orders.
- Volume labels should be interpreted according to the indicator’s data source. Forex tick volume is not a complete measure of centralized market-wide trading volume.
- H1 and H4 analysis can help reduce short-term noise, but confirmed swings may appear later because the indicator needs candles to validate them.
- A sweep does not automatically imply a reversal. Strong trends can continue through previous highs and lows.
- Test the strategy on historical data and in a demo account, including spread, slippage, and realistic stop-loss placement.
Bottom Line
The LuxAlgo Liquidity Swings indicator for MT5 provides a practical way to map swing liquidity and compare potentially significant price levels.
Its strongest use is as a context tool on H1 and H4 charts, where major highs and lows can guide a structured plan.
Combining liquidity sweeps with market-structure confirmation and disciplined risk management offers a consistent framework for evaluating potential reversals and breakouts.