
The Heiken Ashi Candle indicator for MT4 provides a smoother way to read market direction by replacing conventional price candles with Heikin Ashi calculations.
By incorporating information from previous bars, the candles help reduce some of the short-term noise that can make trend direction difficult to assess.
The indicator can be used across Forex, indices, commodities, stocks and cryptocurrencies.
It supports everything from fast intraday charts to higher timeframes, making it suitable for both scalping and day trading.
A particularly effective approach is to establish the direction on a higher timeframe and then look for entries on a lower chart that agree with that bias.
Why traders use the Heiken Ashi Candle Indicator
Regular candlesticks can change direction frequently during periods of market noise.
Heikin Ashi candles smooth this movement, making sustained bullish or bearish phases easier to recognize.
This can help with trend identification, pullback analysis and timing entries around important market levels.
A sequence of bullish candles can indicate persistent buying pressure, while consecutive bearish candles may show that sellers remain in control.
Changes in candle color and the appearance of the candle shadows can also provide an early indication that momentum is changing.
Download This MT4 Indicator for Free
Indicator Chart Setup
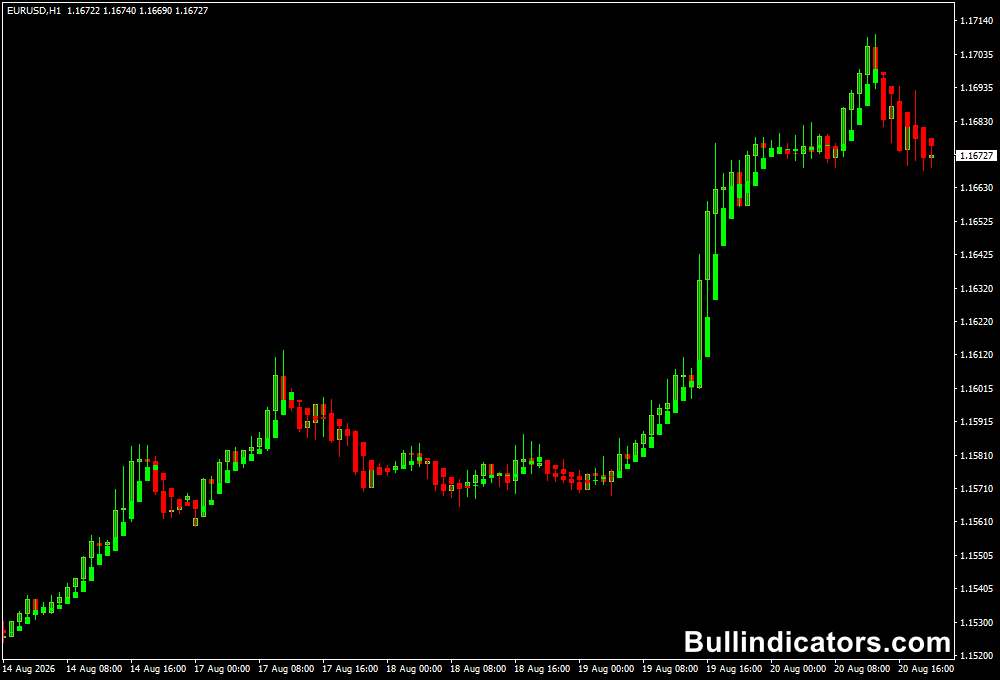
The indicator displays Heikin Ashi candles directly on the MT4 price chart.
These candles are calculated using current and previous price information, producing a smoother representation of the underlying movement.
Bullish candles generally indicate upward momentum, while bearish candles highlight selling pressure.
Candle bodies and shadows can provide additional information about the strength of a move.
A transition from one candle color to another can draw attention to a possible trend change or consolidation phase.
Core Features
- Displays Heikin Ashi candles on MT4 charts.
- Smooths short-term price fluctuations.
- Helps identify bullish and bearish market phases.
- Useful for trend continuation and reversal analysis.
- Supports multiple chart timeframes.
- Can be used across Forex, commodities, indices, stocks and crypto.
- Suitable for standalone analysis or combination strategies.
Best for
- Identifying the dominant market direction.
- Filtering short-term price noise.
- Timing entries during established trends.
- Monitoring potential trend reversals.
- Breakout and pullback analysis.
Best Markets
- EURUSD and GBPUSD for liquid intraday trend movements.
- USDJPY and AUDUSD for steady directional sessions.
- GBPJPY when stronger volatility is preferred.
- Gold (XAUUSD) for trend and breakout analysis.
- US30 and NAS100 when major index trends develop.
- Major cryptocurrencies such as BTCUSD and ETHUSD during directional periods.
Trading Styles
- Day trading with higher-timeframe direction and lower-timeframe entries.
- Trend following on M15, H1 and H4 charts.
- Scalping on M1 and M5 when momentum is strong.
- Swing trading using H4 and D1 trend conditions.
- Breakout trading after a confirmed change in market direction.
How traders use it
A strong multi-timeframe approach is to check the higher timeframe first and trade in that direction.
For example, if the H1 chart is showing a sustained sequence of bullish Heikin Ashi candles, the M15 chart can be monitored for a pullback followed by renewed bullish momentum.
This keeps shorter-term positions aligned with the broader market move.
For day trading, a trader could use H4 to establish the primary direction, H1 to confirm the current trend and M15 for the entry.
EURUSD example
Suppose EURUSD is bullish on H4 and H1, while M15 temporarily moves lower before producing a new sequence of bullish candles.
That transition can provide a potential BUY setup, particularly when it occurs near a previous support level.
The stop can be positioned below the recent swing low, while the target is based on the available market range and risk-to-reward ratio.
The same process works for bearish conditions.
When the higher timeframe remains bearish, lower-timeframe sell opportunities can be prioritized after temporary upward retracements lose momentum.
Get Instant Free Access
Indicator Settings
- Colors: Controls the visual colors used for the Heikin Ashi candles on the MT4 chart.
Important Notes
- Heikin Ashi candles are calculated differently from conventional MT4 candles, so the displayed open and close do not represent the standard market open and close.
- Always check the higher timeframe before taking a lower-timeframe position and prioritize setups that follow the established direction.
- A color change can indicate weakening momentum, but it should not automatically be treated as a reversal signal.
- During sideways conditions, frequent candle changes can produce less reliable trend indications.
- Combining the candles with support and resistance, price action or another trend tool can provide additional confirmation.
- Risk management remains essential, particularly when using the indicator on volatile assets such as gold, indices and cryptocurrencies.









