
The Trend Line Indicator for MT4 uses a Least Square Moving Average (LSMA) calculation to track the prevailing market direction and identify dynamic areas where price may react.
The two plotted lines change between blue and red as market conditions shift, giving traders a practical way to follow directional momentum while monitoring potential support and resistance.
Why traders use the Trend Line Indicator
Trend identification is one of the foundations of technical trading, and this tool makes that process more straightforward.
A blue trend line indicates bullish conditions, while red signals bearish pressure.
The plotted line can also act as a dynamic area where price may find support or resistance.
This makes the Trend Line Indicator useful for combining trend analysis with price action.
A bullish setup near the blue line, for example, can provide a more interesting long opportunity than a similar pattern that develops far away from the prevailing trend.
The same principle applies to short setups during bearish conditions.
Download This MT4 Indicator for Free
Indicator Chart Setup
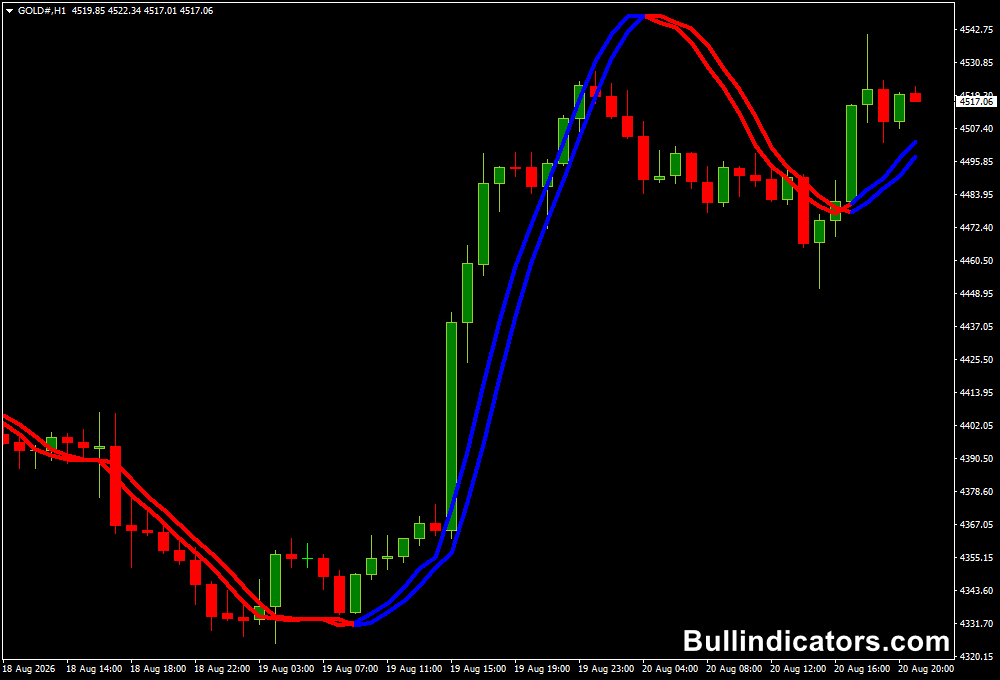
The Trend Line Indicator plots its dynamic trend lines directly on the MT4 price chart.
The line changes color according to the detected direction, with blue representing bullish conditions and red representing bearish conditions.
Since the calculation is based on LSMA rather than conventional manually drawn trend lines, the plotted level continuously adapts to changing price conditions.
Price interaction with the line becomes particularly useful.
A pullback toward the line followed by a bullish rejection can support a long setup when the line remains blue.
During bearish conditions, a recovery toward the red line followed by rejection can provide a potential short opportunity.
Core Features
- LSMA-based dynamic trend line calculation
- Blue and red colors for directional conditions
- Dynamic support and resistance reference
- Non-repainting MA-based approach
- Suitable for multiple MT4 timeframes
- Can be combined with candlestick and price-action signals
Best for
- Following established market trends
- Identifying pullback entries
- Finding dynamic support and resistance
- Confirming breakout and rejection setups
- Filtering counter-trend trades
Best Markets
- EURUSD: A strong choice for M5 to H1 trend trading because of its liquidity and generally tight spreads.
- GBPUSD: Useful for London-session pullbacks and directional moves on M15 and H1.
- USDJPY: Well suited to intraday trend setups, particularly around active London and New York periods.
- Gold (XAUUSD): Can be applied to H1 and H4 charts when looking for larger directional moves.
- Major indices: The same trend-following concept can be tested on liquid stock-index CFDs.
Trading Styles
- Scalping on M1 and M5
- Intraday trading on M15 and H1
- Swing trading on H4 and D1
- Price-action trend following
- Breakout and pullback strategies
How traders use it
A practical approach is to establish the direction from the line color first and then wait for price to interact with the dynamic level.
During a bullish phase, look for a pullback toward the blue line followed by a bullish candle pattern, rejection or false break.
During a bearish phase, focus on recoveries toward the red line followed by bearish price action.
Strategy with pin bar indicator
For example, on EURUSD M15, a blue line combined with a bullish pin bar at the dynamic support area can provide a potential BUY setup.
The stop loss can be positioned below the recent swing low, while profit can be targeted at the previous high or the next resistance area.
For a SELL setup, wait for the line to turn red and allow price to retrace toward it.
A bearish engulfing candle, rejection wick or failed breakout around the line can provide confirmation.
A stop loss above the recent swing high and a target near the next support area can create a defined risk-to-reward setup.
Get Instant Free Access
Indicator Settings
- Rperiod: Determines how many price bars are considered when calculating the trend line level.
- LSMA_period: Sets the Least Square Moving Average period used to determine the market direction.
Important Notes
- The blue or red line should be treated as trend guidance rather than a standalone BUY or SELL signal.
- Price action around the dynamic line can provide additional confirmation before entering.
- Shorter LSMA settings can react more quickly but may produce more changes during sideways markets.
- Higher settings generally create a smoother trend reference and may suit slower trading styles.
- For scalping, focus on highly liquid pairs with low spreads and trade during active market sessions.
- Always define the stop loss around a logical swing point instead of relying solely on the trend line.









