
The Volume Average indicator for MT5 is a practical volume analysis tool that combines a traditional volume histogram with a moving average calculated from volume data rather than price.
This allows you to quickly determine whether trading activity is increasing or decreasing while monitoring the current market direction.
Unlike the standard MetaTrader 5 volume display, this version already includes a volume moving average, eliminating the need for additional workarounds.
The colored histogram provides immediate visual feedback about price direction and the relationship between fast and slow volume averages, making it much easier to evaluate the strength behind a market move.
Rather than generating automatic entry arrows, this tool helps measure market participation.
Strong volume often confirms trends and breakouts, while weakening volume can warn that momentum is fading.
Why traders use the Volume Average Indicator
Professional market participants know that price tells only part of the story.
Volume reveals how much activity supports a move, making it an important confirmation tool.
The Volume Average Indicator helps identify periods of increasing participation, slowing momentum, and potential accumulation or distribution by larger market participants.
Many traders combine volume analysis with support and resistance, trend-following systems, or candlestick patterns.
When rising prices are supported by increasing volume, the probability of trend continuation often improves.
Likewise, a rally on declining volume may suggest weakening buying interest and a possible reversal.
Download This MT5 Indicator for Free
Indicator Chart Setup
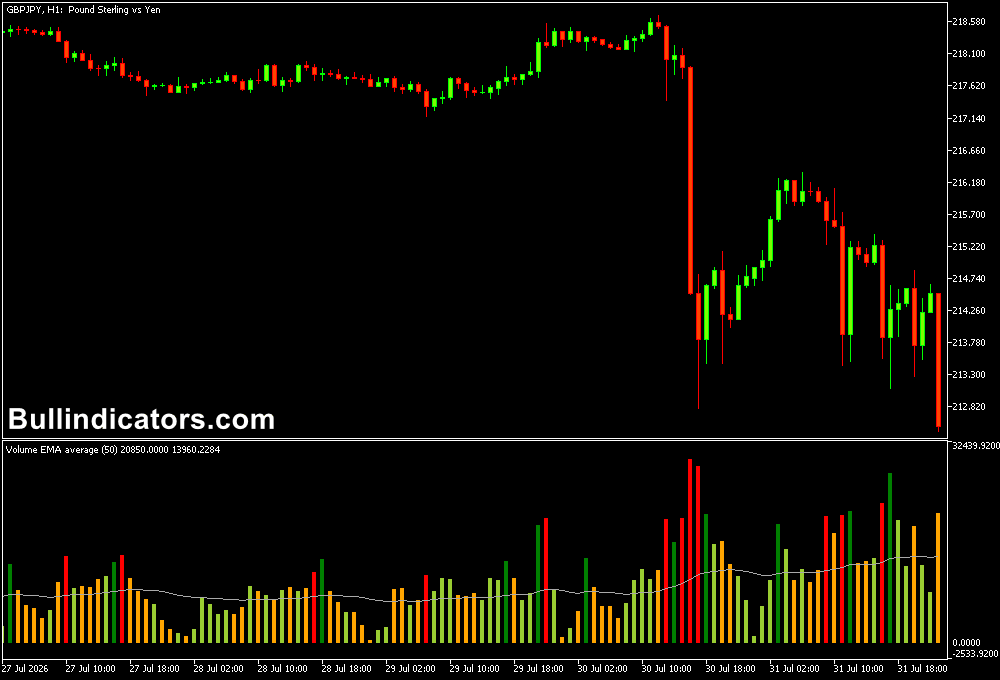
The indicator opens in a separate window below the price chart.
A colored volume histogram displays every trading period, while a moving average line smooths overall volume activity.
Different bar colors represent both price direction and the relationship between the fast and slow volume averages, allowing you to recognize changes in participation at a glance.
Core Features
- Displays a color-coded volume histogram.
- Includes a moving average based on volume values.
- Supports both tick volume and real volume.
- Helps confirm trend strength and market participation.
- Does not repaint historical data.
- Suitable for Forex, indices, commodities, stocks, and cryptocurrencies.
Best for
- Confirming trend strength.
- Volume-based market analysis.
- Finding accumulation and distribution phases.
- Supporting breakout confirmation.
- Filtering lower-quality trade setups.
Best Markets
- EUR/USD – High liquidity makes volume changes more useful when confirming breakouts and trend continuation.
- GBP/USD – Strong London session volatility allows volume spikes to highlight increased market participation.
- USD/JPY – Works well for confirming momentum during trending conditions on intraday charts.
- XAU/USD (Gold) – Helpful for validating strong breakouts and identifying periods where momentum begins to weaken.
- Major stock indices – Markets such as NAS100 and US30 often benefit from volume confirmation during trend continuation and pullbacks.
- Stocks and cryptocurrencies – Particularly valuable where real trading volume is available to measure buying and selling pressure.
Trading Styles
- Scalping on M5 and M15 while confirming momentum with rising volume.
- Day trading on M30 and H1 using volume to validate breakouts.
- Swing trading on H4 and Daily charts to evaluate trend strength.
- Position trading using Daily and Weekly charts to monitor long-term participation.
- Price action strategies supported by volume confirmation.
How traders use it
The Volume Average Indicator is designed as a confirmation tool rather than a complete trading system.
For example, during a bullish trend, increasing volume while price continues making higher highs suggests buyers remain active.
If price continues climbing while volume steadily decreases, buying pressure may be fading and caution becomes appropriate.
A common volume analysis technique is identifying accumulation.
During a decline, large volume combined with relatively small bearish candles may indicate institutional buying is absorbing selling pressure.
The opposite situation can occur during an uptrend, where strong volume and slowing price movement suggest distribution before a possible reversal.
Example Setup with Trend Magic Indicator
For even stronger setups, combine this tool with the Trend Magic Indicator for MT5.
When Trend Magic plots a blue trend line and the Volume Average Indicator shows increasing bullish volume, both momentum and participation support the long setup.
Likewise, a red Trend Magic line together with rising bearish volume provides additional confirmation for short positions.
Using trend direction together with volume analysis helps eliminate many weak countertrend trades.
Get Instant Free Access
Indicator Settings
- Volume Type to Use – Choose between tick volume or real volume, depending on the available market data.
- Average Period – Sets the calculation period for the volume moving average.
- Average Method – Selects the moving average type used for smoothing volume data.
- Colors – Customize the histogram and moving average colors to suit your chart template.
Important Notes
- Volume should be used to confirm price action, not as a standalone entry signal.
- Higher volume generally increases the reliability of breakouts and trend continuation.
- Declining volume during a strong move may indicate weakening momentum.
- Combine volume analysis with trend-following tools and support or resistance zones.
- The indicator works across all timeframes, from M5 to Monthly charts.
- Practice reading volume behaviour before relying on it in live trading.









