
The ZigZag Indicator for MT5 is one of the most widely used market structure tools available for technical analysis.
Rather than displaying every minor price fluctuation, it connects significant swing highs and swing lows with straight lines, making the overall trend much easier to interpret.
By filtering out small price movements, the indicator reveals the market’s underlying structure and helps identify meaningful turning points.
This simplified view is particularly useful when studying trend development, chart patterns, Elliott Wave structures, and Fibonacci retracements.
Although the ZigZag Indicator does not generate direct buy or sell signals, it provides valuable context that allows traders to make better-informed trading decisions.
Since it adapts to any timeframe and market, the indicator has become a popular companion for both discretionary price action trading and advanced technical analysis.
Why traders use the ZigZag Indicator
The biggest advantage of the ZigZag Indicator is its ability to remove unnecessary market noise.
Financial markets rarely move in a straight line.
Even strong trends consist of pullbacks and temporary corrections that can make chart analysis difficult.
By highlighting only significant swings, the indicator creates a much cleaner picture of price movement.
Many traders rely on the ZigZag Indicator to identify higher highs, higher lows, lower highs, and lower lows.
It is also commonly used for drawing Fibonacci retracement levels, counting Elliott Waves, spotting harmonic formations, and recognizing classic chart patterns such as double tops, double bottoms, and head-and-shoulders formations.
Download This MT5 Indicator for Free
Indicator Chart Setup
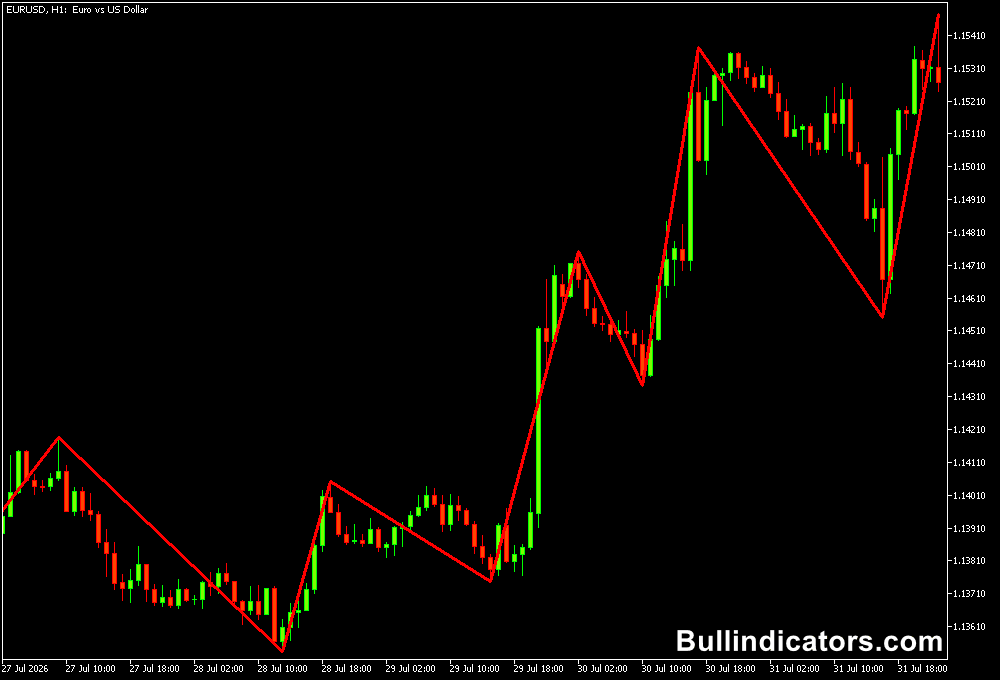
Once applied, the indicator draws connected lines between important swing highs and swing lows while ignoring smaller market fluctuations.
As new price extremes develop, the most recent leg can be recalculated, which means the latest section of the ZigZag may repaint until the swing has been confirmed.
Earlier swing points remain fixed once the market establishes a new significant high or low.
Core Features
- Filters out minor price fluctuations.
- Highlights significant swing highs and lows.
- Excellent for market structure analysis.
- Supports Elliott Wave counting.
- Works well with Fibonacci retracements.
- Useful for identifying chart patterns.
Best for
- Studying market structure.
- Finding higher highs and lower lows.
- Drawing Fibonacci retracement levels.
- Confirming chart patterns.
- Planning swing trades.
Best Markets
- EUR/USD – Clean trending behaviour makes swing highs and lows easier to identify for Fibonacci analysis.
- GBP/JPY – Strong volatility creates well-defined price swings that suit market structure analysis.
- USD/CHF – Useful for identifying trend continuation after healthy pullbacks.
- XAU/USD (Gold) – Helps visualize major swings during volatile market conditions.
- NAS100 – Effective for mapping impulsive moves and corrective waves during index trends.
- Major Forex pairs – Suitable for both intraday and long-term swing analysis.
Trading Styles
- Swing trading on H4 and Daily charts.
- Position trading using Daily and Weekly timeframes.
- Intraday trend analysis on M30 and H1.
- Elliott Wave analysis across multiple timeframes.
- Price action trading supported by Fibonacci retracements.
How traders use it
The ZigZag Indicator is best viewed as a market structure tool rather than an entry system.
A common approach is to wait until the indicator confirms a new swing high or swing low before searching for price action confirmation.
Practical Examples
For example, imagine EUR/USD rallies from 1.1450 to 1.1620 before pulling back to 1.1545.
The ZigZag Indicator clearly marks these swings, making it easy to draw Fibonacci retracement levels.
If price finds support near the 61.8% retracement and forms a bullish engulfing candle before continuing higher, the combination provides a much stronger long setup than relying on Fibonacci alone.
Another practical example is trading a double bottom.
Suppose GBP/USD declines twice to approximately 1.2840 while the ZigZag Indicator highlights both lows.
Once price breaks above the neckline following the second bottom, the pattern becomes much easier to recognize and can provide a high-probability bullish opportunity.
Likewise, head-and-shoulders and double-top formations become significantly easier to identify because unnecessary market fluctuations have already been filtered out.
Get Instant Free Access
Indicator Settings
- ExtDepth – Defines the minimum number of bars used to identify significant highs and lows.
- ExtDeviation – Sets the minimum price movement required before a new swing point is created.
- ExtBackstep – Specifies the minimum number of bars separating consecutive swing highs and lows.
Important Notes
- The most recent swing may repaint until a new high or low is confirmed.
- Use the indicator to analyse market structure rather than generate standalone entries.
- Combining it with Fibonacci retracements can improve support and resistance analysis.
- Works especially well for identifying Elliott Waves and harmonic patterns.
- Higher timeframes generally produce more reliable swing points.
- Always confirm potential setups with price action or another trend confirmation tool before entering a trade.









