
The Darvas Boxes NMC indicator for MT5 is a powerful price action tool designed to detect market consolidation areas, momentum breakouts, and possible trend reversals.
It is based on the famous Darvas Box trading method developed by Nicholas Darvas, a stock trader who became well known after growing a $25,000 account into a multi-million-dollar fortune.
Unlike many technical tools that attempt to forecast future price movements, this system reacts to current market behavior.
It automatically creates boxes around important highs and lows, helping traders identify areas where price is building momentum before a potential breakout occurs.
Why traders use Darvas Boxes NMC Indicator
Many traders use the Darvas Boxes NMC Indicator because it provides a simple way to visualize market ranges and breakout opportunities.
The indicator focuses on price movement and momentum, making it useful for spotting strong directional moves after periods of consolidation.
The automatically drawn boxes help define support and resistance zones without requiring manual analysis.
When price escapes from a Darvas box, it can signal that buyers or sellers have gained control of the market.
The additional buy and sell arrows make it easier to recognize possible entry points.
This approach can be applied to different markets and timeframes, from short-term intraday setups to longer swing trading opportunities.
Download This MT5 Indicator for Free
Indicator Chart Setup
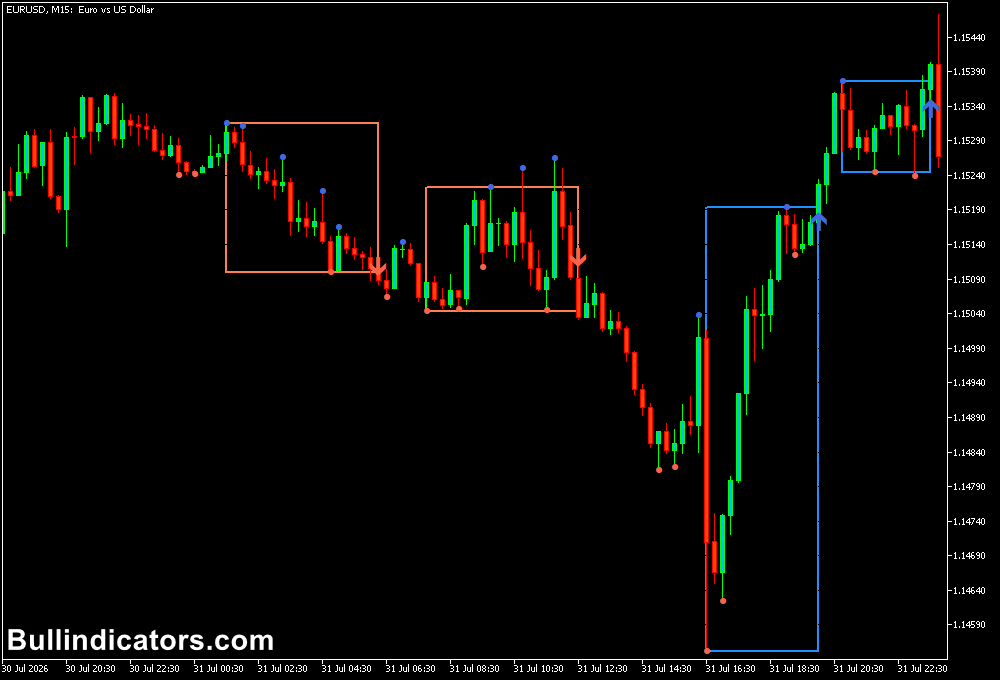
The Darvas Boxes NMC Indicator displays automatically created price boxes directly on the MT5 chart, highlighting important market ranges and breakout areas.
These boxes highlight consolidation areas, breakout levels, and potential reversal points.
Rising boxes usually appear during bullish conditions, while declining boxes can develop during bearish market phases.
The indicator can also display arrows that highlight possible long and short opportunities when price breaks important levels.
Core Features
- Automatically draws Darvas boxes around significant price ranges.
- Identifies momentum breakout opportunities.
- Displays potential buy and sell arrows.
- Highlights support and resistance areas.
- Works on short-term and long-term charts.
- Can be adapted for Forex, stocks, and other financial markets.
Best for
- Finding breakout setups after price consolidation.
- Identifying short-term trend direction.
- Locating important support and resistance zones.
- Trading momentum movements with visual confirmation.
- Analyzing both intraday and swing market conditions.
Best Markets
- XAU/USD: Useful for detecting gold breakout movements during active trading sessions.
- EUR/USD and GBP/USD: Suitable for liquid Forex pairs with frequent momentum phases.
- GBP/JPY: Can highlight strong volatility moves on shorter charts.
- Stock markets: Applicable for shares with clear price expansion patterns.
- Major indices: Can help identify directional moves after market compression.
Trading Styles
- Scalping: Use lower timeframes such as M1 and M5 to capture quick breakout moves.
- Intraday trading: Apply the method on M15 and H1 charts for session-based opportunities.
- Swing trading: Use H4 and D1 charts to follow larger market trends.
- Momentum trading: Focus on strong moves after a completed consolidation phase.
How traders use it
The Darvas Boxes NMC Indicator is mainly used to trade breakouts from price ranges.
When the market moves sideways, the indicator creates a box showing the current trading area.
A bullish opportunity can appear when a strong candle closes above the upper box boundary, while a bearish setup may develop after price breaks below the lower boundary.
For a buy setup, traders usually wait for price to break above the resistance side of the Darvas box.
A stop loss can be placed below the lower section of the box or below the breakout candle, depending on the trading strategy.
For a sell setup, traders look for a move below the support side of the box.
The stop loss is commonly positioned above the upper box boundary.
Exits can be managed using fixed profit targets, nearby support or resistance zones, or an opposite signal from the indicator.
Get Instant Free Access
Indicator Settings
- Darvas Mode – Changes the method used for box construction with values from 0 to 3.
- Pivot Strength in Bars – Adjusts the number of bars used to calculate pivot points.
- Rolling Period of Evaluation – Controls the historical period used for calculations.
- Neutral Color – Sets the appearance of the neutral market condition line.
- Uptrend Color – Defines the color used during bullish conditions.
- Down Trend Color – Defines the color used during bearish conditions.
- Box Width – Controls how many candles are included inside each Darvas box.
- Boxes Mode – Enables or disables the display of Darvas boxes.
- Channel Mode – Activates or disables Darvas channel construction.
- Pivots Mode – Controls pivot point calculations.
Important Notes
- The Darvas Boxes NMC Indicator reacts to price action and does not predict future market movements.
- Breakout signals are stronger when combined with volume analysis or additional confirmation tools.
- False breakouts can occur during low volatility periods or ranging markets.
- The indicator can be customized for different trading styles and timeframes.
- Always test settings on a demo account before applying them to live trading.









