
The SSL Channel Chart indicator for MT5 is a trend-following tool based on moving average calculations that identifies potential bullish and bearish market changes.
The indicator creates two channel lines that change position and color when the market direction shifts, providing an easy way to recognize trend momentum.
Designed for technical analysis, the SSL Channel Chart displays clear BUY and SELL signals when the indicator lines cross.
It can be used on short-term charts for intraday trading or higher timeframes for identifying larger market trends.
Why traders use the SSL Channel Chart Indicator for MT5
Trend direction is one of the most important factors in Forex analysis.
Trading in the direction of the dominant market movement can help avoid many low-quality setups, especially when combined with proper confirmation methods.
The SSL Channel Chart simplifies trend identification by showing bullish and bearish conditions directly on the price chart.
A bullish crossover indicates increasing buying pressure, while a bearish crossover highlights potential selling momentum.
The indicator is non-repainting, meaning previous signals remain fixed after they appear.
This makes it suitable for traders who want consistent crossover signals without historical changes affecting their analysis.
Download This MT5 Indicator for Free
Indicator Chart Setup
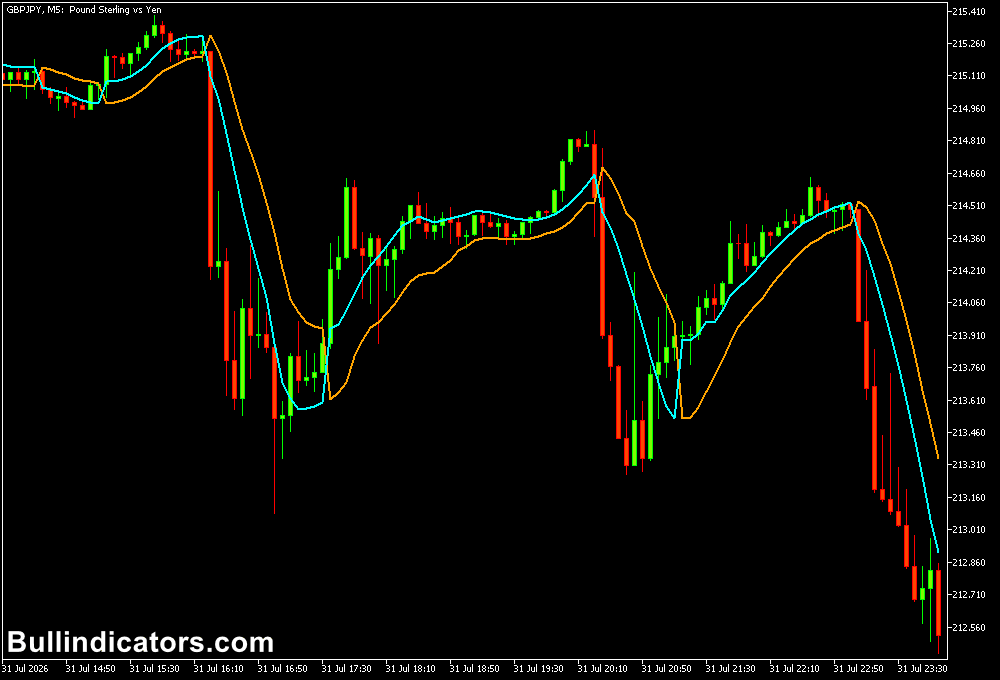
The SSL Channel Chart displays two moving average-based lines on the MT5 chart.
The lines change color according to the current market direction, making it easier to identify bullish and bearish phases.
When the bullish line crosses above the bearish line, the indicator signals a possible upward trend.
A downward crossover indicates that sellers may be gaining control.
The signals can be applied as standalone trend references or combined with additional technical tools for stronger confirmation.
Core Features
- Provides bullish and bearish crossover signals.
- Based on moving average calculations.
- Non-repainting indicator design.
- Displays trend direction directly on the chart.
- Simple BUY and SELL signal interpretation.
- Suitable for multiple trading timeframes.
Best for
- Identifying the current market trend.
- Following moving average crossover strategies.
- Finding trend continuation opportunities.
- Combining with momentum indicators for confirmation.
- Building multi-timeframe trading approaches.
Best Markets
- EURUSD, GBPUSD, USDJPY, and other major pairs with strong liquidity.
- Forex majors during London and New York sessions when directional moves are more common.
- GBPJPY and EURJPY for stronger intraday trends and momentum movements.
- XAUUSD during periods of increased volatility.
- Stock indices such as NASDAQ and US30 for trend-following setups.
Trading Styles
- Scalping on M5 and M15 charts using crossover signals with momentum confirmation.
- Intraday trend trading on M30 and H1 timeframes.
- Swing trading on H4 and D1 charts following larger market trends.
- Multi-timeframe analysis by identifying direction on higher charts and entries on lower charts.
- Trend continuation strategies after pullbacks toward support and resistance zones.
How traders use it
The SSL Channel Chart Indicator works best when used as a trend filter rather than relying on every crossover as an immediate entry.
Professional technical analysis often combines trend direction with price structure, support and resistance levels, or momentum confirmation.
For example, on the GBPCHF H1 chart, a trader can wait for the green SSL line to cross above the red line.
If price is also trading above an important support area, a BUY setup may be considered.
The stop loss can be placed below the latest swing low, while the trade can be managed until an opposite SSL signal appears.
Scalping with this indicator
For scalping, the indicator can be applied to the M5 chart.
A trader may wait for EURUSD to move above a short-term resistance level while the SSL Channel turns bullish.
A BUY entry after the bullish crossover at 1.0920 with a stop loss below the recent M5 swing low at 1.0914 creates a 6-pip risk.
If price reaches 1.0932 before the next bearish crossover, the trade produces a 12-pip gain, offering a 1:2 risk-to-reward setup.
A multi-timeframe approach can improve signal quality.
The H4 chart can define the main trend direction, while the M15 or M5 chart can be used to find more precise entries.
This helps avoid taking short-term signals against the larger market movement.
Get Instant Free Access
Indicator Settings
- Method – Select the calculation method used by the indicator.
- Colors – Customize the appearance of bullish and bearish channel lines.
Important Notes
- The indicator is designed for trend analysis and crossover-based strategies.
- Lower timeframe signals appear more frequently but may require additional filtering.
- Combine signals with price action, momentum, or support and resistance analysis.
- Higher timeframes generally provide stronger trend information.
- Always apply proper risk management when trading crossover signals.









