
The Keltner Channel indicator for MT5 is a trend-following and breakout tool that helps identify the current market direction and potential price expansion zones.
The indicator creates a dynamic channel around an exponential moving average, using volatility measurements to adjust the distance of the upper and lower bands.
Unlike fixed support and resistance levels, Keltner Channels adapt to changing market conditions.
When price moves strongly outside the channel, it can indicate increasing momentum, while changes in the channel slope can help identify developing trends or possible reversals.
Why traders use the Keltner Channel Indicator for MT5
The biggest challenge in Forex trading is often determining whether the market is trending or moving sideways.
The Keltner Channel provides a simple way to evaluate market direction by observing the position and slope of the channel.
A rising channel suggests bullish conditions, while a declining channel indicates bearish momentum.
The indicator can also highlight breakout opportunities when price closes beyond the upper or lower band.
The Keltner Channel is often compared with Bollinger Bands, but its calculation method based on EMA and ATR makes it less reactive to short-term price noise.
This can help reduce false breakout signals while keeping important market movements visible.
Download This MT5 Indicator for Free
Indicator Chart Setup
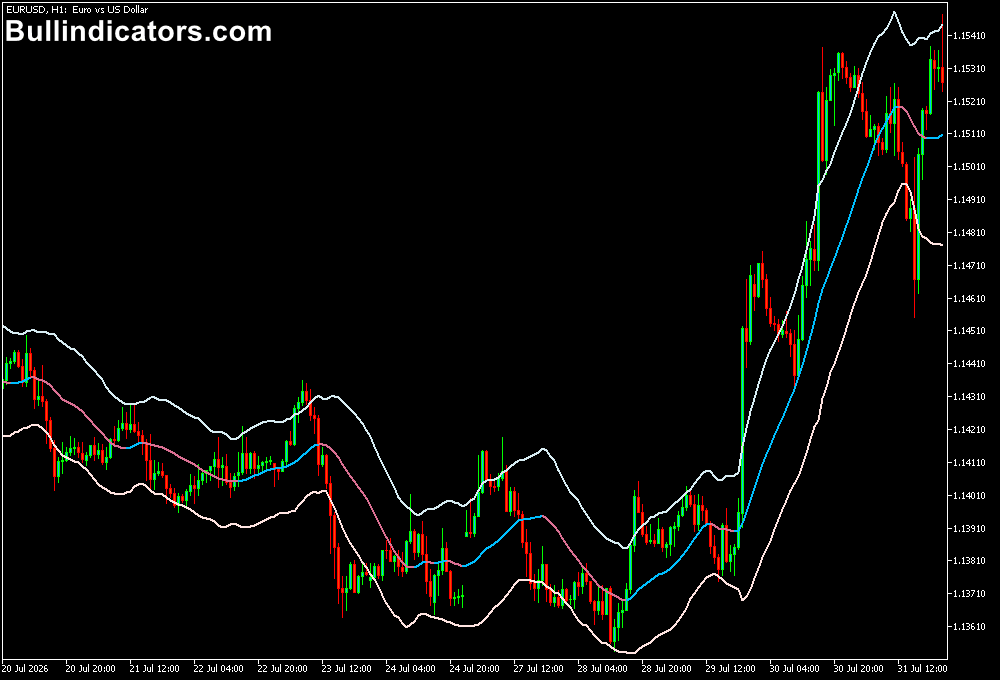
The Keltner Channel displays three lines on the MT5 price chart.
The middle line represents the moving average, while the upper and lower bands create the volatility range around the market price.
When the channel moves upward, buyers are controlling the market.
A downward-sloping channel indicates selling pressure.
Price trading near the outer bands can signal momentum continuation, while a move back inside the channel may indicate a potential correction.
Core Features
- Identifies bullish and bearish market trends.
- Displays dynamic support and resistance zones.
- Uses moving average and ATR calculations.
- Highlights potential breakout opportunities.
- Adjustable sensitivity through moving average and range settings.
- Suitable for scalping, intraday, and trend-following strategies.
Best for
- Finding the dominant market direction.
- Trading channel breakouts with momentum confirmation.
- Identifying possible trend continuation setups.
- Filtering trades in combination with other indicators.
- Helping beginners understand price trends visually.
Best Markets
- EURUSD, GBPUSD, and USDJPY for clean intraday trend movements.
- Major Forex pairs during London and New York sessions when liquidity increases.
- GBPJPY and other volatile crosses for stronger breakout setups.
- XAUUSD when gold enters strong directional movements.
- US indices such as NASDAQ and US30 during active market hours.
Trading Styles
- Scalping on M1 and M5 charts using channel breakouts and momentum confirmation.
- Intraday trading on M15 and H1 timeframes following the channel direction.
- Trend trading on H1 and H4 charts using the middle line as a dynamic trend guide.
- Breakout strategies during London and New York sessions.
- Reversal setups when price reaches extreme channel levels.
How traders use it
The Keltner Channel can be used as a complete market structure tool or combined with additional confirmation indicators.
A common method is trading breakouts when price closes outside the channel while the channel slope supports the direction.
For example, if EURUSD is trading in an upward-sloping Keltner Channel on the M15 chart, a bullish breakout above the upper band can be considered when momentum remains strong.
A stop loss can be placed below the latest swing low to protect against a false breakout.
Scalpers can apply the same concept on lower timeframes.
Scalping Example
On the M1 chart, a trader may wait for the Keltner Channel to turn upward, then look for price to break above the upper band.
For example, EURUSD moves from 1.0850 to 1.0860 during the London session.
The candle closes above the upper Keltner band while the channel slope turns higher.
A buy entry at 1.0861 with a stop loss below the recent M1 swing low at 1.0855 gives a 6-pip risk.
If price continues toward 1.0873, the trade achieves a 12-pip gain with a 1:2 risk-to-reward ratio.
Another approach is combining the indicator with momentum tools to avoid weak signals.
Breakouts supported by strong market momentum generally have a higher probability of continuation.
Get Instant Free Access
Indicator Settings
- Time Frame – Select the timeframe used for calculating the channel.
- Moving Average Period – Adjusts the sensitivity of the moving average.
- Moving Average Type – Choose between SMA and EMA calculation methods.
- Middle Line Visible – Enable or disable the central moving average line.
- Moving Average Price – Select the price type used in calculations.
- Color for Slope Up – Customize the bullish channel color.
- Color for Slope Down – Customize the bearish channel color.
- Range Period – Controls the ATR-based volatility calculation.
- Range Multiplier – Adjusts the width of the Keltner Channel.
Important Notes
- The indicator works best when combined with market context and price action analysis.
- Lower timeframes require confirmation because false breakouts occur more frequently.
- Increasing the moving average period creates smoother signals with more delay.
- Smaller settings make the indicator react faster but may produce more signals.
- Always use appropriate stop-loss placement based on recent market structure.









