
The Donchian Channel indicator for MT5 is a trend-following tool designed to identify market direction, breakout opportunities, and potential pullback entries.
The indicator creates a channel based on the highest high and lowest low over a selected period, allowing traders to visualize current market momentum and volatility.
Originally developed for trend-following strategies, the Donchian Channel remains popular among Forex traders because of its simple interpretation.
Expanding channels indicate increasing volatility, while narrow channels often appear during quieter market conditions before a potential price expansion.
Why traders use the Donchian Channel Indicator for MT5
The main advantage of the Donchian Channel is its ability to highlight important price levels where new trends may begin.
When price breaks above the upper channel, buyers are showing strength, while a move below the lower channel suggests increasing selling pressure.
The indicator can also be used during established trends.
After an initial breakout, traders often monitor pullbacks toward the channel area for additional entry opportunities.
This makes the Donchian Channel useful for both trend continuation and breakout strategies.
Another benefit is its flexibility.
The indicator can be adjusted for different trading styles, from short-term intraday analysis to longer-term swing trading approaches.
Download This MT5 Indicator for Free
Indicator Chart Setup
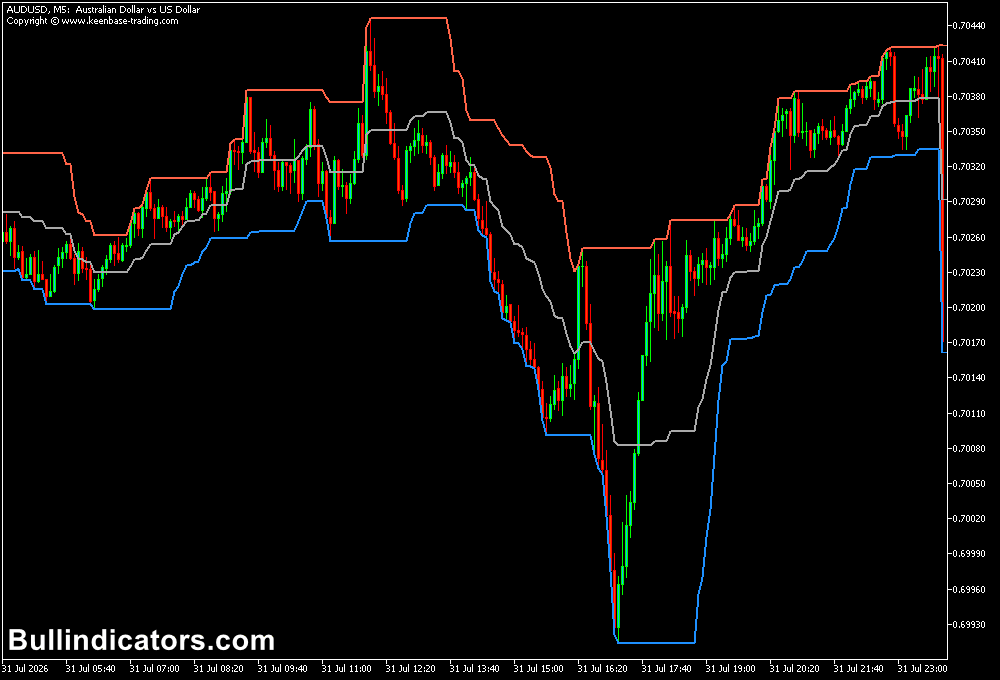
The Donchian Channel displays three lines on the MT5 chart: an upper band, middle line, and lower band.
The upper and lower boundaries are calculated from previous price highs and lows, creating a dynamic trading range.
When the channel slopes upward, the market is generally moving higher.
A downward slope indicates bearish pressure, while a flat channel suggests consolidation.
Breakouts beyond the channel boundaries can signal the beginning of a stronger directional move.
Core Features
- Identifies trend direction using dynamic price channels.
- Highlights breakout levels based on previous highs and lows.
- Measures changes in market volatility.
- Provides potential pullback entry zones.
- Works on all MT5 timeframes.
- Includes alerts for potential trading opportunities.
Best for
- Breakout trading strategies.
- Trend-following systems.
- Finding continuation entries during strong trends.
- Identifying market consolidation before volatility expansion.
- Multi-timeframe technical analysis.
Best Markets
- EURUSD, GBPUSD, USDJPY, and other major currency pairs with strong liquidity.
- Forex majors during London and New York sessions when breakouts are more common.
- GBPJPY and other volatile crosses for larger directional movements.
- XAUUSD during strong trending phases and increased volatility periods.
- US indices such as NASDAQ and US30 for momentum-based breakout analysis.
Trading Styles
- Intraday breakout trading on M15 and H1 charts.
- Scalping strategies on M5 charts during active market sessions.
- Swing trading on H4 and D1 charts using larger trend movements.
- Trend-following strategies after confirmed channel breakouts.
- Position trading using higher timeframe market direction.
How traders use it
The Donchian Channel is commonly used to trade breakouts when price moves beyond the established range.
A basic approach is to wait for a candle close above the upper band for a BUY opportunity or below the lower band for a SELL setup.
For example, EURUSD is trading on the H1 chart inside a narrow Donchian Channel after several hours of consolidation.
Price breaks above the upper band at 1.0850, confirming increased buying pressure.
A trader enters a BUY position after the breakout, places a stop loss below the recent swing low at 1.0825, and manages the position until the trend loses momentum or an opposite signal appears.
The indicator can also support trend continuation strategies.
After a bullish breakout, a pullback toward the middle or lower part of the channel may provide another opportunity to join the existing trend.
The same principle applies during bearish market conditions.
A multi-timeframe approach can improve analysis.
For example, the daily chart can define the main market direction, while the H1 or M15 chart can be used to identify more precise entry points.
This helps align shorter-term trades with the broader trend.
Get Instant Free Access
Indicator Settings
- History Bars – Defines the number of historical candles used for calculation.
- Periods – Sets the calculation period of the Donchian Channel.
- Channel Time-Frame – Selects the timeframe used for channel calculations.
- Upper Band Color – Adjusts the appearance of the upper channel line.
- Middle Band Color – Changes the color of the central channel line.
- Lower Band Color – Adjusts the appearance of the lower channel line.
- Draw Price Tags – Displays current price values of the channel bands.
- Alerts – Enables notifications when important channel events occur.
Important Notes
- The Donchian Channel is a trend and breakout tool, not a standalone trading system.
- False breakouts can occur during sideways market conditions.
- Higher timeframe signals generally provide stronger trend information.
- Combine breakout signals with momentum, volume, or price action analysis.
- Adjust the period settings according to the market and trading style.









