
The Power Trend indicator for MT4 is a trend strength analysis tool that helps identify not only the direction of the market but also the quality of the current trend.
Many trend-following tools can show whether price is moving higher or lower, but they often provide limited information about the strength behind the move.
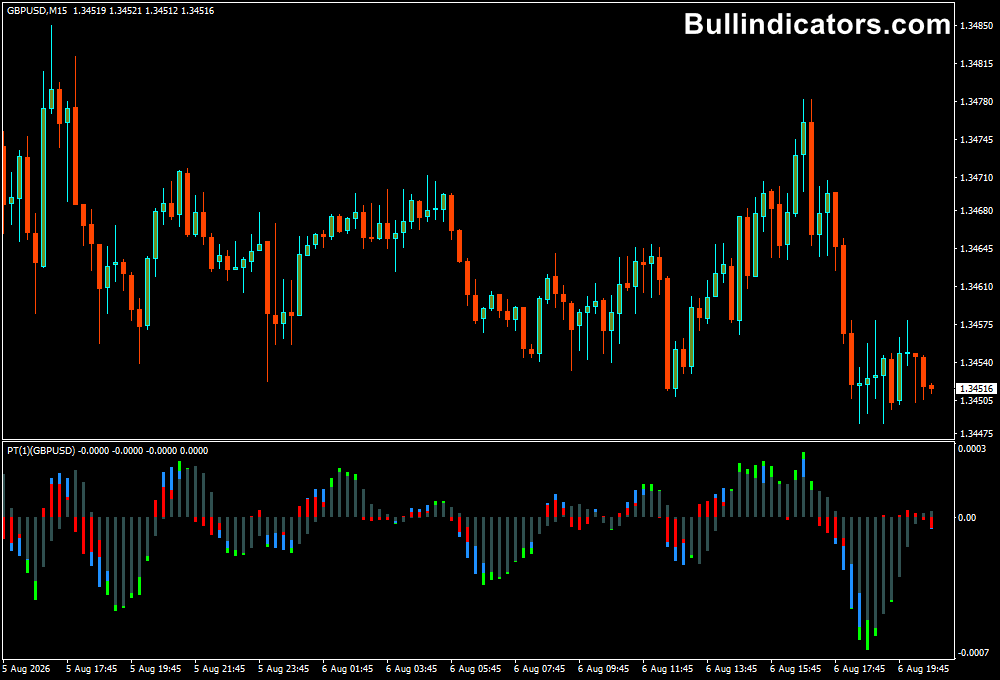
The Power Trend Indicator solves this by displaying trend strength through a color-coded histogram.
The colors change depending on market conditions, helping traders recognize weak periods, developing trends, moderate momentum and strong directional moves.
The histogram position relative to the zero line also provides trend direction.
Readings above zero indicate bullish conditions, while readings below zero suggest bearish market conditions.
This combination of direction and strength can help traders decide when to enter, hold or avoid a position.
Why traders use the Power Trend Indicator
The biggest advantage of the Power Trend Indicator is the visual representation of trend maturity.
Instead of only showing that a market is moving upward or downward, it helps estimate whether the move has enough momentum to continue.
The histogram uses four main colors:
- Black represents weak momentum or a market without a clear trend.
- Red indicates that a new trend may be developing.
- Blue shows a moderate trend.
- Green represents a strong established trend.
This information can be useful for trade management.
Many traders close profitable positions too early because they are unsure whether the trend has more room to continue.
A transition from blue to green can indicate increasing momentum and may help traders stay with stronger moves for longer.
During sideways markets, the black histogram can act as a warning that conditions are less suitable for trend-following strategies.
Download This MT4 Indicator for Free
Indicator Chart Setup
The Power Trend Indicator appears as a histogram in a separate MT4 window.
The location of the histogram compared with the zero line helps identify the market direction.
When the histogram remains above zero, the market has a bullish bias.
When it stays below zero, bearish conditions dominate.
The changing colors provide additional information about the strength and development stage of the trend.
Core Features
- Identifies bullish and bearish market direction.
- Measures trend strength through color changes.
- Black histogram indicates weak or ranging conditions.
- Red histogram indicates a developing trend.
- Blue histogram represents moderate trend strength.
- Green histogram highlights strong momentum.
- Works across multiple MT4 timeframes and markets.
- Helps with trend continuation and trade management.
Best for
- Identifying strong directional market conditions.
- Filtering out weak trends and sideways periods.
- Managing existing trend-following positions.
- Confirming entries from other technical methods.
- Finding potential periods where momentum is increasing.
Best Markets
- Major Forex pairs with strong directional movement.
- Currency crosses that experience extended trends.
- Commodity markets such as gold and silver during high-momentum periods.
- Major stock indices when clear bullish or bearish trends develop.
- Highly liquid markets where sustained momentum creates cleaner trend phases.
- Markets trading on M15, H1 and H4 charts where trend strength is easier to evaluate.
Trading Styles
- Trend-following strategies.
- Intraday momentum trading.
- Swing trading on higher timeframes.
- Position management for existing trades.
- Multi-timeframe confirmation strategies.
How traders use it
The Power Trend Indicator is often used to determine whether a market environment supports trend trading.
A trader can focus on bullish setups when the histogram is above zero and showing blue or green strength.
Bearish setups become more relevant when the histogram remains below zero.
Power Trend Forex Strategy with Super Trend Indicator
For additional confirmation, the Power Trend Indicator can be combined with the Super Trend Indicator for MT4.
Super Trend provides a clear trend direction using a colored line, where a green line indicates a bullish market trend and a red line indicates a bearish market trend.
Buy Rules
- Super Trend must display a green line, confirming a bullish market trend.
- Power Trend should be above the zero line.
- Prefer entries when the histogram changes from blue to green, showing increasing momentum.
- Enter after both tools confirm the bullish direction.
- Hold the position while Super Trend remains green and Power Trend maintains bullish strength.
- Consider exiting when Power Trend turns black/red or Super Trend changes to red.
Sell Rules
- Super Trend must display a red line, confirming a bearish market trend.
- Power Trend should remain below the zero line.
- Look for red or increasing bearish histogram readings.
- Enter after both indicators confirm downside momentum.
- Hold the position while Super Trend remains red and Power Trend supports the bearish move.
- Consider exiting when Power Trend weakens or Super Trend changes back to green.
For example, on an H1 EUR/USD chart, Super Trend changes to green after a bullish reversal.
The Power Trend histogram moves above zero and changes from blue to green, showing that momentum is increasing.
This combination can help a trader avoid exiting too early and remain with the trend while strength continues.
During weaker conditions, if Super Trend remains unchanged but Power Trend turns black, it can indicate that momentum is fading.
This may be a signal to reduce exposure or wait for stronger confirmation before entering new positions.
Get Instant Free Access
Indicator Settings
- PT_chart: Selects the chart timeframe used for trend analysis.
- PT_Period: Defines the calculation period used for measuring trend strength.
- Higher periods can create smoother readings with fewer changes.
- Lower periods can make the indicator react faster to recent price movements.
Important Notes
- The Power Trend Indicator is designed to measure trend conditions, not predict exact market turning points.
- Strong color readings do not guarantee that a trend will continue indefinitely.
- Black histogram periods often indicate that trend-following entries should be avoided.
- Combining trend strength with a directional tool such as Super Trend can improve market filtering.
- Higher timeframe analysis can help avoid taking trades against the dominant market direction.
- Test different PT_Period settings because each market and timeframe can react differently.









