
The Super Trend indicator for MT4 is a popular trend-following tool designed to identify market direction and possible trend reversals.
It uses a single adaptive trend line that changes color according to the current market condition, helping traders quickly recognize whether buyers or sellers are controlling price action.
The indicator calculates trend levels using volatility-based calculations and adjusts its position as the market moves.
During bullish conditions, the line appears below price and acts as dynamic support. During bearish conditions, it moves above price and can function as a resistance level.
With its simple visual approach and non-repainting design, the Super Trend Indicator is suitable for traders who want a clear method for analyzing trends, managing trades, and identifying possible entry and exit areas.
Why traders use the Super Trend Indicator for MT4
Identifying the market trend is one of the foundations of technical analysis.
The Super Trend Indicator helps traders filter market direction by showing whether price is moving within a bullish or bearish environment.
The color change provides a quick overview of possible trend shifts.
A green line indicates upward momentum, while a red line highlights potential selling pressure.
This makes the indicator useful for traders who want to avoid entering trades against the current market direction.
The Super Trend line can also be used as a trailing stop reference.
As price continues in the expected direction, the indicator adjusts with the trend, helping traders manage open positions and protect profits.
Download This MT4 Indicator for Free
Indicator Chart Setup
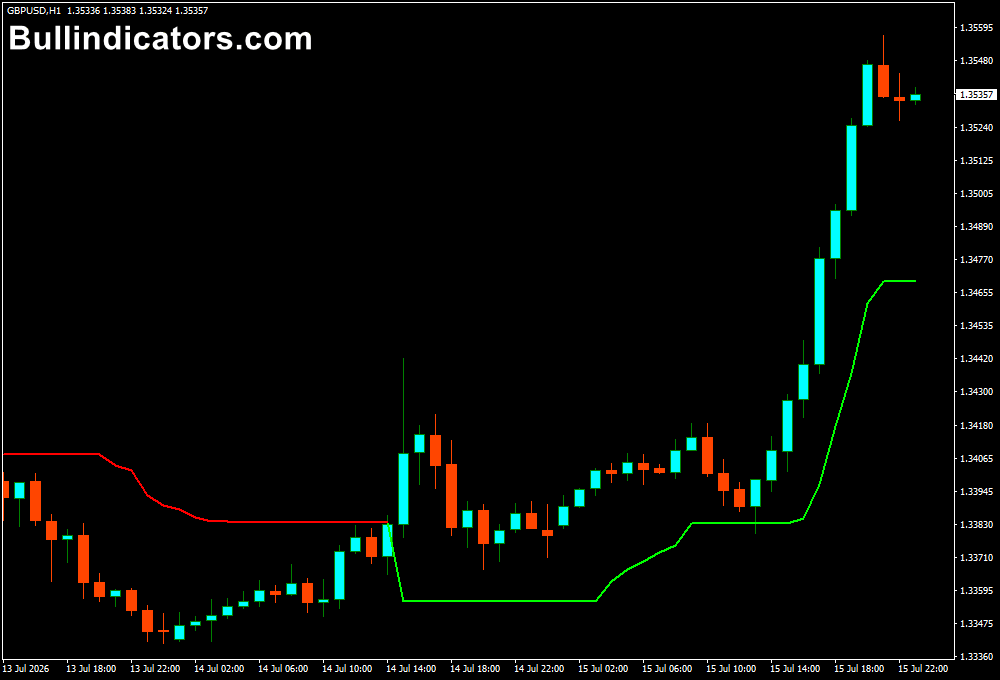
After installing the Super Trend Indicator on an MT4 chart, a single colored line appears directly on the price chart.
When price remains above the indicator line, the market is considered bullish and the line turns green.
When price moves below the line, the indicator changes to red, showing possible bearish momentum.
During periods of consolidation, the Super Trend line may remain flat as the market lacks strong directional movement.
These situations often indicate that traders should wait for a breakout before looking for new opportunities.
Core Features
- Non-repainting trend indicator for MT4.
- Displays bullish and bearish market conditions.
- Uses volatility-based trend calculations.
- Provides dynamic support and resistance levels.
- Highlights possible trend reversal points.
- Can be used for entries and trade exits.
- Suitable for multiple timeframes.
- Customizable line appearance.
Best for
- Identifying market direction.
- Following established trends.
- Finding potential reversal points.
- Managing trailing stops.
- Filtering trades during unclear market conditions.
Best Markets
- Forex pairs that develop strong directional moves.
- Major currency pairs during active trading sessions.
- Stock indices with clear intraday trends.
- Gold (XAUUSD), where trend-following tools can help manage volatility.
- Stocks and CFDs showing sustained momentum.
Trading Styles
- Scalping on M5 and M15 charts when quick trend changes are required.
- Intraday trading on M15, M30, and H1 timeframes.
- Swing trading on H1 and H4 charts to capture larger price movements.
- Position trading on H4 and Daily charts using wider trend movements.
- Trend-following strategies where trades remain open while the Super Trend direction continues.
How traders use it
A common approach is to trade in the direction of the Super Trend signal.
When the indicator changes to green and price remains above the line, traders start looking for buying opportunities.
When the line turns red and price moves below it, attention shifts toward possible selling setups.
The indicator can also be used as a breakout confirmation tool.
If price moves sideways and the Super Trend line remains stable, traders often wait for a strong move above or below the line before entering a position.
For trade management, the Super Trend line can act as a dynamic stop level.
A trader holding a buy position may continue following the trend while price remains above the line.
If price closes below the indicator, it may signal that the trend is weakening and the position should be reviewed.
Get Instant Free Access
Indicator Settings
- Multiplier: Adjusts the distance between price and the Super Trend line. Higher values create a wider trend line, while lower values make the indicator react faster to price changes.
- Colors: Customize the bullish and bearish line colors.
- Line Width: Changes the thickness of the indicator line displayed on the chart.
Important Notes
- The indicator works best when combined with proper market analysis.
- Sideways markets can produce fewer reliable trend signals.
- Higher multiplier settings create fewer but potentially stronger signals.
- Lower multiplier settings make the indicator react faster to price movements.
- Always consider market volatility before placing trades.
- The Super Trend line can be used as a trailing stop reference.









