
The ZigZag Color indicator for MT5 is a practical swing-analysis tool designed to simplify price movement by connecting significant highs and lows with colored ZigZag lines.
By filtering out many smaller price fluctuations, it makes progressive and corrective waves easier to follow on the MetaTrader 5 chart.
This can help with identifying potential reversal areas, locating recent swing points, and timing entries after a retracement.
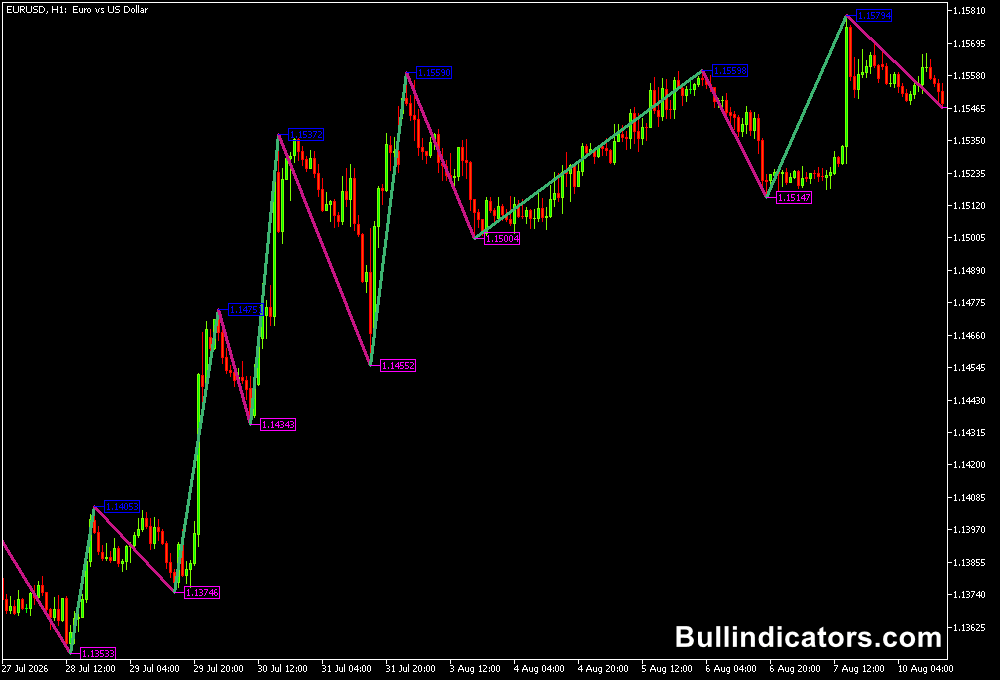
The indicator displays green and red ZigZag movements directly on the price chart.
The changing direction of these lines provides a straightforward way to assess whether price is developing an upward or downward movement.
It can be applied to forex pairs as well as other markets and works across short-term and higher timeframes.
Why traders use the Zig Zag Color Indicator
One of the main advantages of the Zig Zag Color Indicator is its ability to reduce attention on minor price fluctuations.
The resulting swing pattern gives the chart a cleaner representation of major price movements, making recent highs, lows and corrective phases easier to assess.
The indicator is particularly useful when combined with market structure and support or resistance analysis.
A trader can monitor whether price is forming higher swing lows, lower swing highs, or reversing after a corrective wave.
It can also be used as a framework for setting stop-loss levels around recent swing points.
Download This MT5 Indicator for Free
Indicator Chart Setup
Once applied to a MetaTrader 5 chart, the indicator draws colored ZigZag lines across the price action.
Green and red sections highlight directional swings, while the turning points mark important highs and lows used by the calculation.
The chart can be used to distinguish progressive waves from corrective movements.
For example, during an upward move, a trader can wait for a downward correction and then monitor the next green upswing for confirmation that bullish momentum is returning.
Core Features
- Colored ZigZag lines for easier swing identification.
- Highlights significant highs and lows on the price chart.
- Filters many smaller price fluctuations.
- Helps identify progressive and corrective waves.
- Useful for reversal and retracement analysis.
- Adjustable ZigZag calculation parameters.
- Works across intraday and higher timeframes.
Best for
- Identifying recent swing highs and swing lows.
- Analyzing corrective waves within larger trends.
- Finding potential reversal points.
- Planning entries around confirmed price turns.
- Positioning stop losses around recent market swings.
Best Markets
- GBPJPY – well suited to short-term swing analysis because of its frequent price movements.
- EURUSD – useful for intraday trend and retracement analysis.
- GBPUSD – suitable for identifying directional swings during active sessions.
- Gold (XAUUSD) – useful on M15 and H1 charts when analyzing larger price waves.
- Major forex pairs – particularly effective when liquidity and directional movement are strong.
Trading Styles
- Scalping – GBPJPY M5 and EURUSD M5 can be used to monitor short corrective moves and subsequent reversals.
- Intraday trading – M15 and H1 charts provide a broader view of developing price waves.
- Swing trading – H4 and D1 charts can help identify larger market turning points.
- Multi-timeframe analysis – use H1 or H4 to establish the dominant direction and M5 or M15 to refine an entry.
How traders use it
A basic approach is to first determine the prevailing direction from the sequence of ZigZag swings.
In an uptrend, attention can be placed on higher swing lows and the beginning of a new upward leg.
In a downtrend, lower swing highs and renewed downward movements can provide the framework for bearish setups.
GBPJPY M5 Scalping Example
The Zig Zag Color Indicator can be particularly useful for short-term GBPJPY trading when the goal is to enter after a corrective move has completed.
The following M5 example combines swing direction, ZigZag reversals and higher-timeframe confirmation to create a structured approach for both bullish and bearish setups.
- Identify the direction: Check the recent ZigZag swings and establish whether GBPJPY is forming higher highs and higher lows.
- Wait for a correction: During a bullish sequence, allow price to retrace rather than chasing the previous upward move.
- Watch the ZigZag turn: When the corrective phase starts to lose momentum and the ZigZag turns upward, look for a potential buy entry.
- Set the stop loss: Place the protective stop below the latest confirmed swing low.
- Manage the exit: A position can be closed near a new swing high, at a predefined risk-reward target, or when the price action indicates that the bullish move is weakening.
Bearish GBPJPY Setup
- Confirm bearish structure: Look for lower highs and lower lows on the M5 chart.
- Allow an upward correction: Wait for price to retrace against the bearish move rather than selling during an extended decline.
- Look for a bearish turn: When the corrective move starts to reverse and the ZigZag points downward, consider a sell setup.
- Protect the position: A stop loss can be placed above the latest relevant swing high.
- Plan the exit: Consider taking profit near a fresh swing low, a predefined risk-reward level, or when upward momentum begins to return.
Using a Higher Timeframe
- H1 direction: Use the H1 chart to establish the broader market bias.
- M5 entry: Move to the M5 chart and wait for a corrective wave to develop against the H1 direction.
- Entry confirmation: Look for the ZigZag to turn back in the direction of the higher-timeframe trend.
- Reduce countertrend trades: This multi-timeframe approach helps distinguish short-term corrections from potentially larger market reversals.
Get Instant Free Access
Indicator Settings
- ExtDepth – controls the depth used in the ZigZag calculation.
- ExtDeviation – defines the deviation threshold used when identifying significant price movements.
- ExtBackstep – determines the minimum separation used between potential swing points.
- ShowPrice – controls the display of price information associated with the ZigZag points.
- nSize – adjusts the size of the displayed visual elements.
- UpColor – controls the color used for upward ZigZag movements.
- DnColor – controls the color used for downward ZigZag movements.
Important Notes
- The ZigZag calculation can change as new highs and lows are formed.
- A recently developing swing should not automatically be treated as a confirmed reversal.
- Use the most recent confirmed swing points when determining trade risk.
- Higher timeframe analysis can help distinguish a normal correction from a broader trend reversal.
- The indicator does not provide a fixed take-profit level, so exits should be planned according to the trading strategy.
- For scalping, combine the ZigZag signals with price action, session conditions and sensible risk management.









