
The Trend Scalp indicator for MT5 is an intraday trend-following tool based on the T3 Smoothed Moving Average.
It is designed to reduce the effect of short-lived price spikes and provide a smoother view of changing market momentum.
The indicator can be used on Forex and stock markets, with particular value for short-term setups where rapid changes in direction can make ordinary moving averages difficult to interpret.
The indicator displays its calculations around a neutral level and uses different colors to help identify market conditions.
Positive values point toward bullish momentum, while negative readings indicate bearish conditions.
The orange and blue line states also help identify potential oversold and overbought areas, giving the indicator a second function beyond simple trend identification.
Why traders use the Trend Scalp Indicator
Short-term markets frequently produce temporary spikes that can make a trend appear stronger or weaker than it really is.
The T3 calculation applies additional smoothing, allowing the underlying movement to be assessed with less emphasis on every small price fluctuation.
One useful characteristic is the combination of trend direction and market extremes.
An orange line with a negative value can indicate an oversold condition, while a blue line with a positive value can point to an overbought market.
A shift back through the neutral level can then provide a potential momentum reversal signal.
Download This MT5 Indicator for Free
Indicator Chart Setup
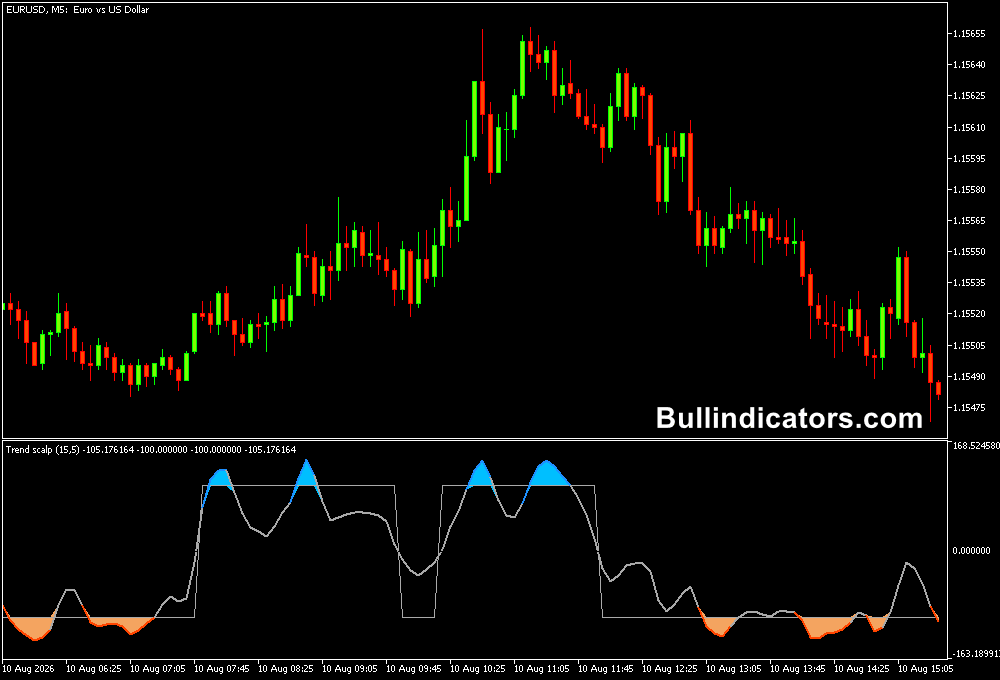
When attached to a MetaTrader 5 chart, the Trend Scalp indicator automatically monitors price movement and plots its trend calculation.
The indicator’s value moves above or below the neutral level as market momentum changes.
A positive reading represents bullish conditions, whereas a negative reading indicates bearish momentum.
The color changes add another layer of interpretation, with orange associated with oversold conditions and blue associated with overbought conditions.
A transition from an extreme reading toward the opposite side of the neutral level can be particularly useful when looking for a change in short-term direction.
Core Features
- Based on the T3 Smoothed Moving Average.
- Designed for intraday trend and momentum analysis.
- Smooths short-lived price fluctuations and market spikes.
- Identifies positive and negative trend conditions.
- Highlights potential overbought and oversold areas.
- Adjustable T3 calculation parameters.
- Suitable for Forex and stock-market analysis.
Best for
- Short-term trend identification.
- Momentum reversal analysis after overbought or oversold conditions.
- Intraday pullback entries.
- Filtering choppy price movement on lower timeframes.
- Combining trend direction with a second confirmation indicator.
Best Markets
- GBPUSD can provide strong intraday movement for M5 and M15 applications.
- EURUSD is well suited to lower-timeframe trend scalping because of its liquidity.
- USDJPY can work well during active Asian and London market periods.
- XAUUSD is an option for experienced users seeking larger intraday movements, although risk should be adjusted for its volatility.
- Liquid major pairs are generally preferable when applying the indicator to very short charts.
Trading Styles
- M5 scalping with M15 confirmation.
- M15 intraday trend following.
- M30 momentum trading after corrective moves.
- H1 trend confirmation for longer intraday positions.
- Reversal trading when an extreme reading returns through the neutral level.
How traders use it
A straightforward method is to wait for an extreme market condition and then monitor whether the indicator moves back through the neutral level.
For a bullish setup, an oversold reading can be followed by a positive transition.
For a bearish setup, an overbought reading can precede a move into negative territory.
GBPUSD Buy Example
Consider GBPUSD on the M5 chart with both the Trend Scalp Indicator and the Super Signals Channel indicator applied.
First, look at the channel direction.
If the Super Signals Channel is rising, the market has a bullish directional bias.
The Trend Scalp Indicator can then be used to time a potential long entry.
- GBPUSD is trading inside or above a rising Super Signals Channel.
- The Trend Scalp Indicator has been below zero with an orange line, showing an oversold condition.
- Price starts to recover and the Trend Scalp reading crosses back above the neutral level.
- Wait for the bullish momentum transition while the Super Signals Channel continues to rise.
- Enter a buy position after the bullish confirmation.
- A practical stop can be placed below the latest M5 swing low.
- Profit can be managed toward the next resistance area or while the Trend Scalp Indicator remains positive.
For example, if GBPUSD pulls back during an existing rising channel and the Trend Scalp reading becomes negative, there is no immediate need to sell simply because momentum has weakened.
If the channel remains bullish and the Trend Scalp turns positive again after the pullback, the two indicators are once again aligned for a potential continuation trade.
GBPUSD Sell Example
The same method can be applied in reverse when GBPUSD is moving through a declining Super Signals Channel.
A falling channel establishes the bearish directional bias, while the Trend Scalp Indicator helps identify when bearish momentum is returning after an upward correction.
- The Super Signals Channel is declining on the GBPUSD M5 chart.
- The Trend Scalp Indicator moves into positive territory with a blue line, indicating an overbought condition.
- GBPUSD begins to lose upward momentum near the channel area or a nearby resistance level.
- The Trend Scalp value falls back below the neutral level.
- Consider a short entry after the bearish transition is confirmed.
- A stop loss can be positioned above the most recent M5 swing high.
- The position can be managed while the channel continues declining and the Trend Scalp reading remains negative.
For instance, a temporary GBPUSD rally inside a declining channel does not necessarily signal a trend reversal.
If the Trend Scalp Indicator becomes overbought and subsequently turns negative while the channel is still pointing downward, the pullback may be ending and the broader bearish move may be resuming.
Get Instant Free Access
Indicator Settings
- Period – determines the number of bars used to evaluate trend intensity.
- T3 Period – controls the number of bars used in the T3 calculation.
- T3 Hot – sets the T3 level used for signal detection.
- T3 Type – determines the type of T3 calculation applied by the indicator.
- Colors – controls the visual colors displayed by the indicator.
Important Notes
- Signals can become less reliable when price remains in a narrow sideways range.
- Very short timeframes require attention to spread and execution costs.
- A positive or negative reading describes momentum direction, not a guarantee of continuation.
- Channel direction can provide useful confirmation when trading Trend Scalp signals.
- Risk levels should be adapted to the current volatility and recent swing points.









