
The Elliott Wave Oscillator for MT5 is a momentum-based tool designed around the principles of Elliott Wave Theory, which describes markets as sequences of advancing and corrective price movements.
The oscillator helps traders examine the strength behind these movements and identify situations where price momentum may be changing.
One of its most useful applications is comparing price extremes with oscillator readings.
During a strong impulse phase, the oscillator can reach an important high or low as momentum accelerates.
Later in the sequence, price may reach another extreme while the oscillator fails to match its previous reading.
This divergence can provide an early warning that the current move is losing strength.
The indicator can be applied to Forex, indices, commodities, stocks and other financial instruments.
Although it can be used for shorter-term analysis, its wave and divergence characteristics are particularly useful on medium- and higher-timeframe charts.
Why traders use the Elliott Wave Oscillator
Elliott Wave analysis can become difficult when market movements contain numerous smaller fluctuations.
The oscillator provides a quantitative way to examine momentum during these price swings, making it easier to compare the strength of different impulse phases.
A particularly serious situation occurs when price reaches a new high or low but the oscillator produces a weaker corresponding extreme.
This divergence suggests that momentum is no longer developing at the same pace as price.
It does not automatically confirm a reversal, but it can help identify areas where a trend deserves closer attention.
Download This MT5 Indicator for Free
Indicator Chart Setup
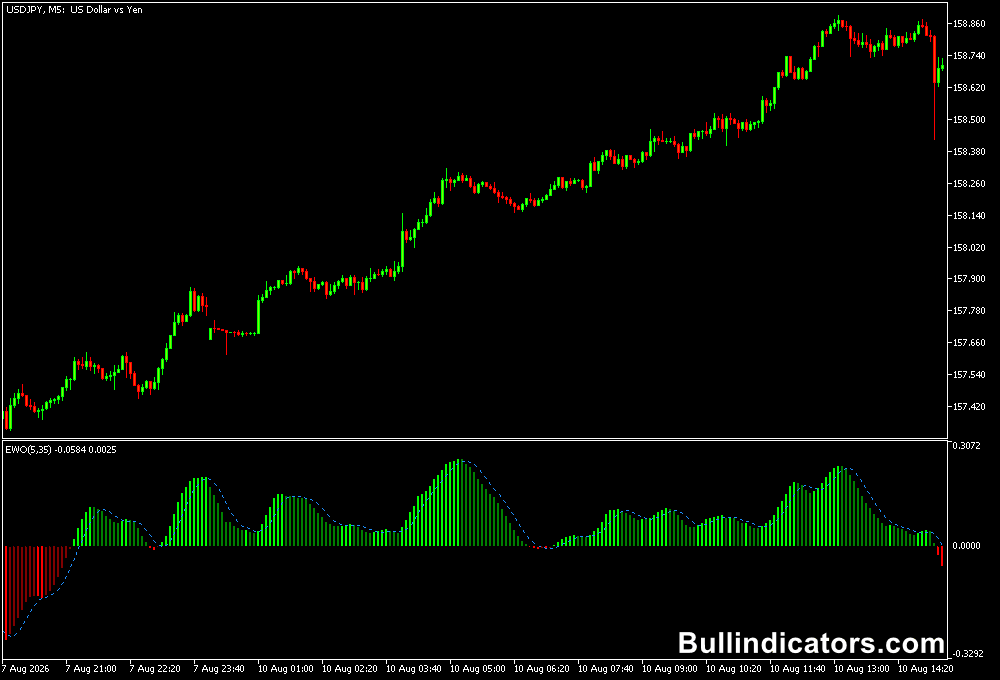
When attached to a MetaTrader 5 chart, the Elliott Wave Oscillator appears in a separate indicator window below the price chart.
Its readings fluctuate around a central level as bullish and bearish momentum changes.
The oscillator can be used to compare successive price movements and assess whether momentum is strengthening or weakening.
Strong impulse waves generally produce more pronounced oscillator readings, while a weaker oscillator response during a fresh price extreme can create a divergence worth monitoring.
Core Features
- Based on concepts associated with Elliott Wave Theory.
- Measures momentum during advancing and declining market phases.
- Useful for comparing successive price extremes.
- Can highlight bullish and bearish divergence.
- Works across Forex, stocks, indices and commodities.
- Optional moving average display.
- Adjustable fast and slow calculation periods.
Best for
- Identifying weakening momentum near potential wave completions.
- Studying impulse and corrective market phases.
- Spotting divergence between price and momentum.
- Medium-term swing analysis.
- Confirming whether a new price extreme is supported by sufficient momentum.
Best Markets
- EURUSD and GBPUSD provide liquid conditions for wave analysis.
- AUDCAD can be interesting for studying broader directional swings, particularly on H1 and H4.
- USDJPY can suit medium-term momentum analysis during sustained directional moves.
- Gold and major stock indices can produce pronounced swings that make momentum divergence easier to study.
Trading Styles
- M15 swing-intraday analysis when looking for momentum exhaustion.
- H1 trend continuation and reversal setups.
- H4 swing trading around significant price extremes.
- D1 analysis for larger market waves and major turning points.
- Multi-timeframe analysis using H4 for context and M15 or H1 for entries.
How traders use it
The Elliott Wave Oscillator can be used by comparing the direction and magnitude of price swings with the corresponding oscillator peaks and troughs.
During an advancing sequence, a strong momentum peak may develop during the third impulse wave.
If price subsequently reaches another high but the oscillator produces a lower peak, bearish divergence can indicate that the fifth wave is losing momentum.
The opposite applies during a declining sequence.
A strong negative oscillator reading can accompany a major downward impulse, while a later price low accompanied by a higher oscillator trough may indicate that bearish momentum is fading.
EURUSD M15 Long Example
Suppose EURUSD is moving lower on the M15 chart and the Elliott Wave Oscillator has already produced a deep negative reading during an earlier decline.
Price then makes another lower low, but the oscillator forms a higher low.
This bullish divergence suggests that the latest downward wave is producing less momentum than the previous impulse.
- EURUSD establishes a fresh M15 low.
- The oscillator does not make a corresponding new low.
- The higher oscillator trough creates bullish divergence.
- Wait for price to stabilize and show evidence of a bullish reversal.
- A long entry can be considered after bullish price confirmation.
- Place the stop below the latest M15 swing low.
- Potential targets include the previous swing high or the next significant resistance area.
The key point is that the divergence provides the warning, while the subsequent price action provides the trade trigger.
Entering solely because a higher oscillator low appears can expose the position to another downward wave.
EURUSD M15 Short Example
For a bearish setup, imagine EURUSD has already experienced a strong advance and the oscillator reaches a pronounced positive peak.
Price later pushes to another M15 high, but the Elliott Wave Oscillator forms a lower high.
This bearish divergence indicates that the latest upward wave is losing momentum.
- EURUSD reaches a fresh M15 high after an established advance.
- The oscillator produces a lower high than its previous major peak.
- The price and oscillator are no longer confirming each other.
- Wait for a bearish candle formation, support break or other confirmation of weakening price action.
- A short position can then be considered following the confirmation.
- Place the stop above the recent M15 high.
- Potential targets can be based on the previous swing low or another nearby support zone.
Get Instant Free Access
Indicator Settings
- Fast Period – determines the number of bars used for the fast Elliott Wave calculation.
- Slow Period – controls the longer calculation period used by the oscillator.
- Apply to – selects the price type used for the calculation.
- Method – determines the calculation method for the Elliott Wave component.
- Show MA – enables or disables the moving average line.
- Period – sets the period of the optional moving average.
- Method – selects the calculation method for the moving average.
Important Notes
- Elliott Wave interpretation is not always straightforward because several wave counts can exist within the same price movement.
- Divergence signals potential momentum exhaustion rather than guaranteeing an immediate reversal.
- Higher-timeframe price levels can provide useful context when evaluating M15 signals.
- Strong trends can remain directional even after divergence appears, so confirmation is important.
- Stop placement should account for the recent swing and current market volatility.









