
The Trend Signal indicator for MT5 is designed to identify emerging bullish and bearish trends with directional arrows directly on the price chart.
Green arrows indicate potential upward momentum, while red arrows highlight developing bearish conditions.
The indicator can be used across different market environments, including directional trends, breakouts and ranges.
Its signals can help define the current market bias while also providing reference points for entries, exits and potential support or resistance areas.
Why traders use the Trend Signal Indicator
Entering early in a developing trend can provide a favorable risk-to-reward opportunity, but identifying the transition from consolidation to directional movement is difficult with price action alone.
The Trend Signal Indicator provides a straightforward visual reference when momentum begins shifting.
Green and red arrows make the directional bias easy to monitor without requiring several separate calculations.
A green signal can be used to look for long opportunities, while a red signal can focus attention on short setups.
The indicator is also flexible enough for different trading approaches.
A trend follower can use the arrows to stay aligned with the prevailing direction, while a breakout trader can combine them with key levels and retests.
Range traders can look for signals occurring near established support and resistance.
Download This MT5 Indicator for Free
Indicator Chart Setup
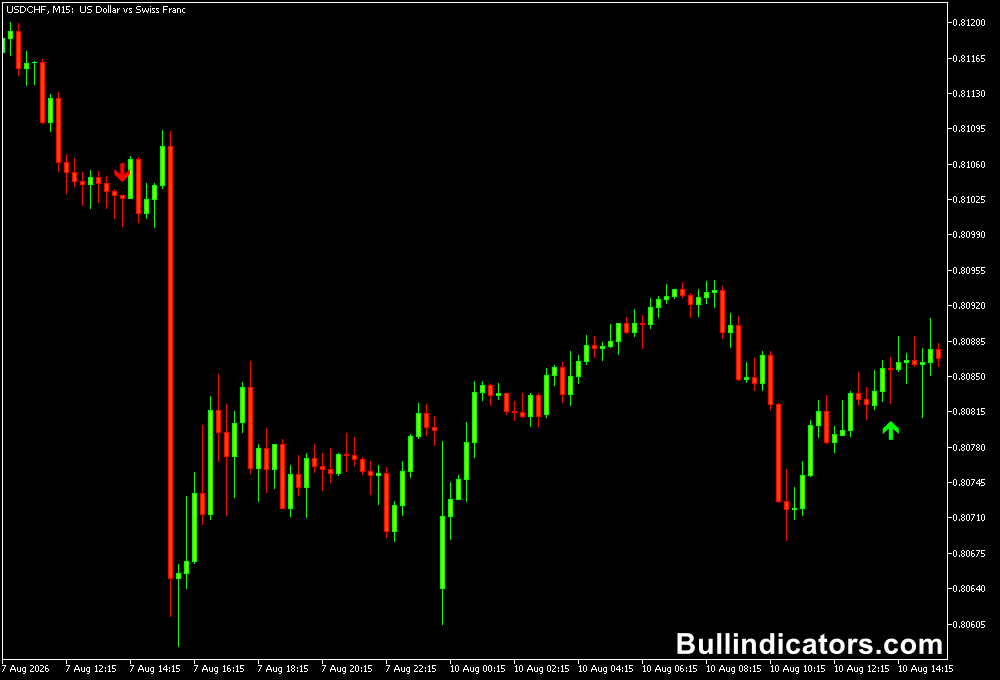
The Trend Signal Indicator is applied directly to the MT5 price chart and displays directional arrows around price.
Green upward arrows indicate a potential bullish trend, while red downward arrows indicate a potential bearish trend.
The signals can be interpreted alongside horizontal price levels.
For example, a green arrow appearing close to established support can provide a potential bullish setup, while a red arrow near resistance can support a bearish scenario.
Core Features
- Displays bullish and bearish directional arrows.
- Identifies potential changes in market direction.
- Can be used for trend, breakout and range strategies.
- Works across M5 to D1 timeframes.
- Provides signals directly on the price chart.
- Signal sensitivity can be adjusted.
- Signal displacement can be configured.
Best for
- Identifying emerging market trends.
- Confirming directional bias before an entry.
- Trading breakouts and subsequent retests.
- Finding potential reversal opportunities around support and resistance.
- Managing existing positions when the opposite signal appears.
Best Markets
- EURUSD and GBPUSD are suitable for intraday trend signals on M15 and H1 charts.
- USDJPY can work well for H1 and H4 directional setups.
- EURJPY and GBPJPY can produce stronger moves for traders comfortable with higher volatility.
- Gold can be monitored on M15, H1 and H4 when a clear directional move develops.
Trading Styles
- Scalping: M5 can be used for short-duration setups, particularly during active London and New York sessions.
- Intraday trading: M15 and H1 provide a practical combination of signal frequency and trend confirmation.
- Trend following: H1 and H4 can be used to follow established directional movements.
How traders use it
The Trend Signal Indicator can be used as a directional trigger or combined with price levels and candlestick confirmation.
Bullish Setup
- Wait for a green upward arrow.
- Give greater importance to signals forming near established support or after a bullish breakout.
- Look for a bullish candle pattern, such as a bullish engulfing candle, for additional confirmation.
- A stop loss can be positioned below the recent swing low or relevant support.
- A later red arrow can be considered an indication to review or close the long position.
Bearish Setup
- Wait for a red downward arrow.
- Prioritize signals near resistance or following a bearish breakout and retest.
- A bearish engulfing candle can provide additional confirmation.
- A stop loss can be placed above the recent swing high or resistance.
- A subsequent green arrow can signal that the short position should be reassessed.
For a short-term example, consider GBPUSD on M5.
If price breaks above a short-term resistance zone and then retests it successfully, a green arrow near the retest can provide a bullish continuation signal.
The recent swing low can define the initial risk, while the next resistance area can be used as a profit target.
Get Instant Free Access
Indicator Settings
- Signal sensitivity control: Adjusts the sensitivity of the Trend Signal Indicator when generating directional signals.
- Signal displacement: Controls the offset or displacement of signals displayed on the chart.
Important Notes
- The indicator is designed for M5 through D1 charts; M1 is best avoided because of the increased amount of short-term market noise.
- Signals can be more effective when they agree with the prevailing higher-timeframe direction.
- Arrows should not automatically be treated as guaranteed reversal or continuation signals.
- Range markets can generate alternating signals, so support and resistance analysis can help filter weaker setups.
- Higher sensitivity may produce more signals, while lower sensitivity can reduce signal frequency.
- Always define the stop loss and acceptable risk before entering a position.









