
The Moving Average Ribbon 1.1 Indicator for MT5 is a straightforward trend-following tool that compares two customizable moving averages directly on the price chart.
By adjusting the periods, calculation methods and applied price, you can configure the ribbon for faster short-term signals or smoother trend analysis.
The relationship between the two averages provides a practical way to assess market direction.
When the faster average moves above the slower average, bullish momentum is developing.
When it falls below the slower average, bearish pressure is gaining control.
The simplicity of the setup makes it suitable for both standalone trend analysis and confirmation alongside price action.
Why traders use the Moving Average Ribbon 1.1 Indicator
Moving averages remain useful because they filter some of the short-term price fluctuations that can make directional analysis difficult.
Using two averages together adds another layer of information: the relative position of the averages shows whether momentum is shifting toward buyers or sellers.
The indicator is also highly configurable. A short MA period can make the ribbon more responsive for scalping and intraday setups, while longer periods can reduce sensitivity and provide a broader view of the prevailing trend.
Different moving average methods can further change the behavior of the signals.
A common application is to use the higher timeframe to establish direction and the lower timeframe to locate an entry.
For example, an H1 bullish bias can be combined with an M15 bullish crossover after a temporary pullback.
Download This MT5 Indicator for Free
Indicator Chart Setup
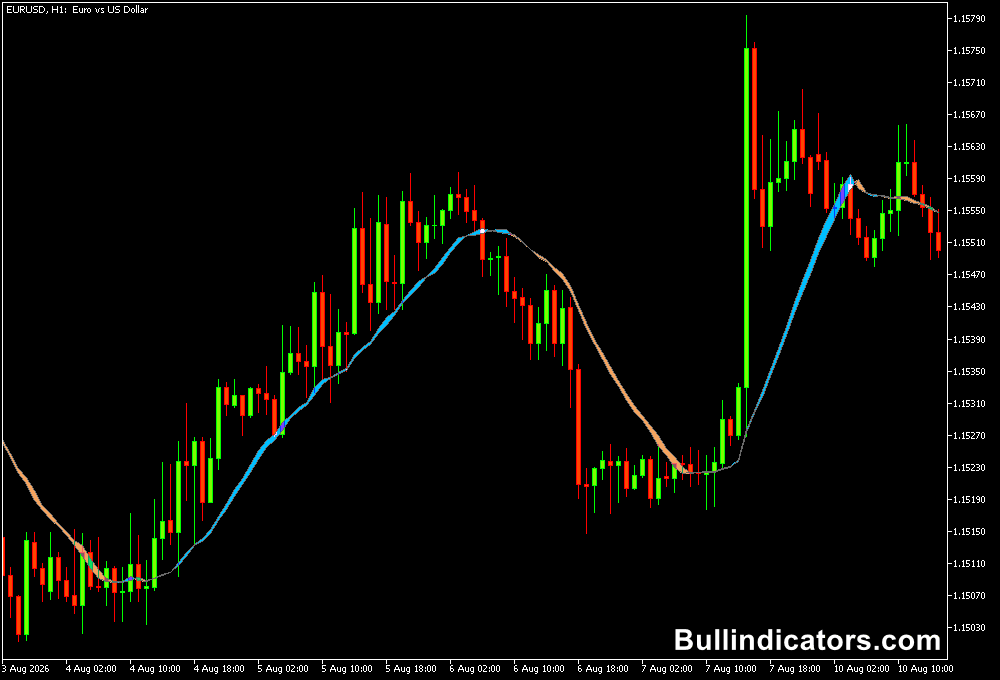
The Moving Average Ribbon 1.1 is displayed directly over the price chart using two moving average lines.
Their distance and position relative to each other change as market momentum develops.
A bullish crossover occurs when MA1 moves above MA2, while a bearish crossover occurs when MA1 moves below MA2.
The separation between the averages can also provide useful information.
Expanding distance can accompany strengthening momentum, while converging averages may indicate that the current trend is losing strength.
Core Features
- Uses two independently configurable moving averages.
- Supports different moving average calculation methods.
- Allows the applied price to be selected for each average.
- Can be adapted for fast or slow trend analysis.
- Provides optional alerts for trading conditions.
- Email notifications can be enabled for supported alerts.
Best for
- Identifying the prevailing market direction.
- Monitoring moving average crossovers.
- Confirming trend continuation after pullbacks.
- Filtering short-term entries according to higher-timeframe direction.
- Building simple MA-based trading systems with customizable parameters.
Best Markets
- EURUSD and USDJPY are suitable for systematic MA crossover analysis due to their liquidity and generally smooth execution.
- GBPUSD can provide stronger intraday movements when a clear directional trend develops.
- EURJPY and AUDJPY can be useful for H1 and H4 trend-following approaches.
- Gold can be monitored with slower settings when the market is producing a sustained directional move.
Trading Styles
- Scalping: M5 and M15 charts with shorter MA periods can capture rapid changes in intraday momentum.
- Intraday: M15 and H1 are suitable for crossover entries and trend continuation setups.
- Swing trading: H4 and D1 charts can use longer periods to focus on broader directional movements.
- Multi-timeframe trading: Use H4 or H1 for the dominant trend and M15 or M5 for more precise entries.
How traders use it
The two moving averages can be used as a directional filter and entry trigger.
The objective is generally to trade in the direction of the dominant crossover rather than react to every short-term fluctuation.
Bullish Setup
- MA1 moves above MA2, indicating improving bullish momentum.
- Price remains above both averages or recovers above them after a pullback.
- A bullish candle or break of a recent swing high can provide entry confirmation.
- The recent swing low can be considered when determining stop-loss placement.
Bearish Setup
- MA1 moves below MA2, indicating increasing bearish pressure.
- Price trades below both averages or rejects them during a corrective move.
- A bearish candle or break of a recent swing low can confirm the entry.
- The recent swing high can provide a reference for stop-loss placement.
For short-term trading, consider EURUSD on M15.
If the H1 averages indicate an established bullish trend, wait for price to retrace toward the M15 averages.
A bullish crossover followed by a strong close above the recent local high can provide a continuation entry.
The next resistance area or a predefined 1:2 risk-to-reward target can be used for profit management.
Get Instant Free Access
Indicator Settings
- MA1Period: Sets the calculation period for the first moving average.
- MA1Method: Selects the calculation method used by the first moving average.
- MA1Price: Defines the price type used for MA1.
- MA2Period: Sets the calculation period for the second moving average.
- MA2Method: Selects the calculation method used by MA2.
- MA2Price: Defines the price type used for the second moving average.
- AlertOn: Enables the indicator’s alerts.
- EmailOn: Enables email notifications for alerts.
Important Notes
- Moving average crossovers are lagging signals because they are calculated from historical price data.
- Shorter periods react faster but can generate more signals during sideways markets.
- Longer periods produce slower signals and are better suited to broader trend analysis.
- Crossovers are generally more reliable when price is moving directionally rather than ranging.
- Combining the averages with support, resistance or higher-timeframe direction can help filter weak setups.
- Alert settings can be enabled when you want the indicator to notify you without continuously monitoring the chart.









