
The Price Position indicator for MT5 is a straightforward chart tool that displays the prevailing market direction through an angled line.
The line changes orientation as the market moves from bullish to bearish conditions, while a neutral color identifies periods when there is no strong directional bias.
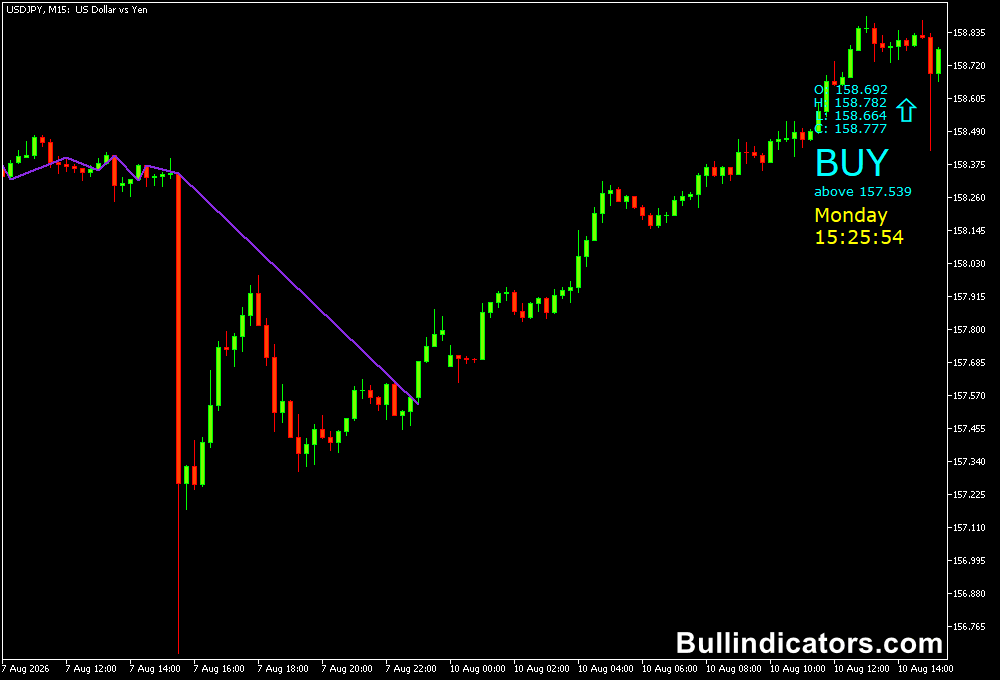
The indicator also places a BUY, SELL or neutral status on the chart and provides the open, high, low and close values of the current candle.
This gives a quick overview of both market direction and current price information without requiring several separate chart tools.
Why traders use the Price Position Indicator
The main advantage of the Price Position Indicator is simplicity.
The angle of the line provides an immediate visual indication of whether price is moving upward or downward, while the status displayed on the chart gives an additional directional reference.
A rising angle can be used to focus on long setups, while a falling angle can direct attention toward short opportunities.
When the indicator switches to its neutral color, the market may be lacking sufficient directional momentum, which can help avoid forcing trades during quiet conditions.
The indicator can also be useful as a trend filter.
or example, a trader may use the H1 direction to establish the broader bias and then look for M15 entries that agree with it.
RSI or a moving average can provide additional confirmation when a more selective approach is required.
Download This MT5 Indicator for Free
Indicator Chart Setup
The Price Position indicator is displayed directly on the price chart as an angled line above price.
During bullish conditions, the line points upward. During bearish conditions, it points downward.
A yellow angle indicates a neutral market condition when the overall direction is less defined.
The upper-right area of the chart also displays the current BUY, SELL or neutral status.
In addition, the indicator reports the open, high, low and close of the current candle, providing useful reference data while analyzing an active setup.
Core Features
- Displays the prevailing market direction through an angled line.
- Provides BUY, SELL and neutral indications.
- Shows the current candle’s open, high, low and close.
- Uses a separate neutral state for markets without a strong directional bias.
- Can be applied across different trading timeframes.
- Includes an optional trend-change alert.
Best for
- Quickly assessing bullish or bearish market direction.
- Filtering trades according to the prevailing trend.
- Identifying periods of weak or neutral momentum.
- Confirming directional bias before entering a position.
- Combining trend information with RSI, moving averages or price action.
Best Markets
- EURUSD and USDJPY are suitable for straightforward trend filtering on intraday charts.
- GBPUSD and EURJPY can provide more pronounced directional moves during active sessions.
- GBPJPY can be considered when larger intraday swings are preferred, with appropriate risk control.
- Gold can be monitored on H1 and H4 when a sustained directional movement develops.
Trading Styles
- Scalping: M5 and M15 can be used to follow short-term directional changes.
- Intraday trading: M15 and H1 provide a useful combination for trend filtering and entry timing.
- Swing trading: H4 charts can help identify broader bullish or bearish conditions.
- Multi-timeframe trading: Use H4 or H1 for the main direction and M15 for more precise entries.
How traders use it
The indicator can be used as a directional filter rather than treating every change in the angle as an automatic entry.
The most useful signals generally occur when the new direction agrees with price structure and other market evidence.
Bullish Setup
- Wait for the angle to turn upward and the indicator to display a BUY condition.
- Prefer signals where price is holding above an established support area.
- A bullish candle pattern or moving average confirmation can strengthen the setup.
- Consider placing the stop below the recent swing low.
- Monitor the indicator for a bearish change when managing an existing long position.
Bearish Setup
- Look for the angle to turn downward and the indicator to display a SELL condition.
- Give greater weight to signals occurring near resistance.
- A bearish candle pattern or momentum confirmation can improve selectivity.
- A stop can be positioned above the recent swing high.
- A subsequent bullish change can be used as a reason to reassess the short position.
For short-term trading, EURUSD on M15 can provide a practical setup.
If the H1 trend is bullish and the Price Position Indicator turns upward on M15 after a pullback toward support, a bullish candle close can be used as confirmation.
The recent swing low can define the initial risk, while the next resistance area can provide a logical profit target.
Get Instant Free Access
Indicator Settings
- Turn On Alert (Yes/No): Enables or disables alerts when the indicator detects a trend change.
- BUY Color: Sets the color used for BUY signals. The default is Aqua.
- SELL Color: Sets the color used for SELL signals. The default is OrangeRed.
- No Trend Color: Sets the color used when the market is considered neutral. The default is Yellow.
Important Notes
- A short-term change in the angle does not necessarily mean that the broader trend has reversed.
- Neutral signals can be useful for recognizing periods when directional trading conditions are weak.
- False signals can occur, particularly during sideways or rapidly changing markets.
- Higher-timeframe direction can help filter short-term signals that conflict with the broader trend.
- RSI, moving averages, support and resistance or price action can be combined with the indicator for additional confirmation.
- Use predefined risk limits and stop-loss levels rather than relying solely on the indicator to manage an open position.









