
The 3 Color MACD Indicator for MT5 is an enhanced version of the traditional Moving Average Convergence Divergence tool, combining the MACD signal line with a color-changing histogram.
This makes it possible to assess both momentum and directional pressure from the same indicator window.
The histogram provides an earlier indication of changes in momentum, while signal-line and zero-line crossovers can be used to confirm broader trend direction.
Because the indicator is non-repainting and works across all MetaTrader 5 timeframes, it can support short-term scalping as well as intraday and longer-term technical strategies.
Why traders use the 3 Color MACD Indicator
A standard MACD can show whether momentum is increasing or decreasing, but the three-color presentation makes these changes easier to interpret during live market conditions.
A bullish histogram color indicates positive momentum, while the bearish color points to selling pressure.
The signal line provides another reference for timing entries and exits.
The combination is particularly useful when price is moving through a transition phase.
A change in histogram color can warn that momentum is weakening before a traditional crossover becomes visible.
Zero-line crossovers then provide additional confirmation that the market may be moving into a new directional phase.
It can also be combined with support and resistance, price action or a separate trend indicator to filter weaker signals.
Download This MT5 Indicator for Free
Indicator Chart Setup
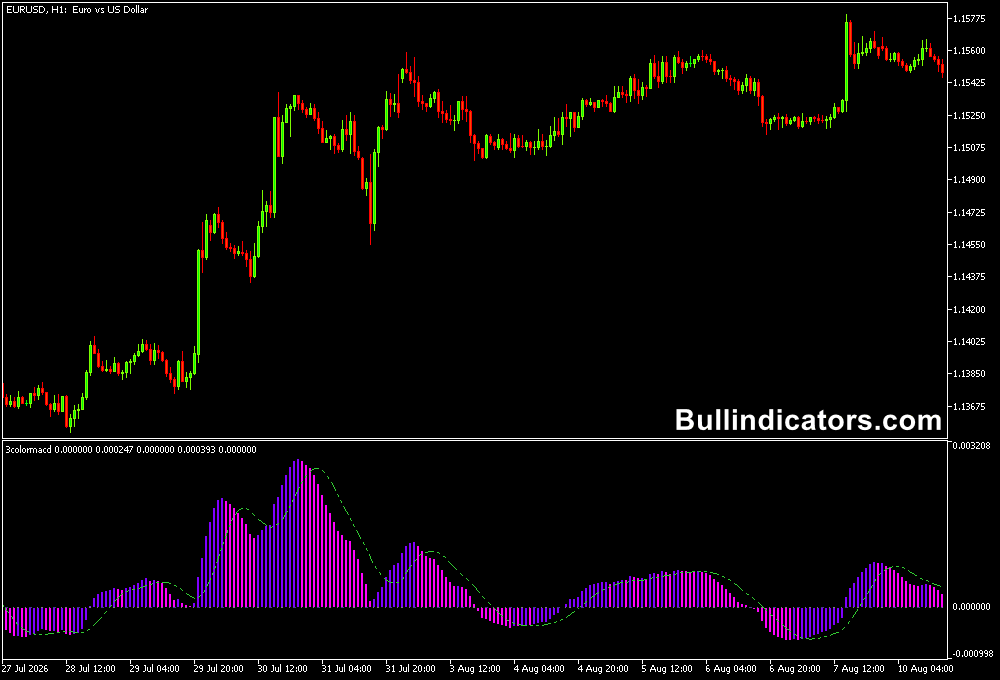
When applied to an MT5 chart, the indicator appears in a separate window below price.
The MACD histogram changes color according to momentum direction, while the signal line provides a smoother reference for crossover signals.
A bullish phase is represented by the green line and blue histogram, while the red line and purple histogram identify bearish conditions.
The distance between the histogram bars and signal line is also useful.
Expanding bars generally indicate increasing momentum, whereas shrinking bars can signal that the current move is losing strength.
Core Features
- Three-color MACD histogram for momentum analysis.
- MACD signal-line crossover signals.
- Zero-line crossover confirmation.
- Non-repainting indicator.
- Works across all MT5 chart timeframes.
- Useful for divergence and convergence analysis.
Best for
- Identifying bullish and bearish momentum phases.
- Spotting weakening momentum before a possible reversal.
- Confirming trend direction after a zero-line crossover.
- Timing pullback entries when momentum resumes.
- Filtering entries around important support and resistance zones.
Best Markets
- EURUSD: Well suited to intraday momentum setups on M5, M15 and H1.
- GBPJPY: Useful for fast directional moves where momentum changes quickly.
- Gold (XAUUSD): Effective for identifying expanding and contracting momentum during London and New York sessions.
- US indices: Suitable for momentum-based setups during the main cash-market session.
Trading Styles
- M5 scalping: Combine the MACD with a higher-timeframe trend filter for short momentum trades.
- M15 intraday trading: Use histogram color changes with signal-line crossovers to time continuation entries.
- H1 trend trading: Give greater weight to zero-line crossovers and sustained histogram momentum.
- H4 swing setups: Use the indicator to monitor broader momentum changes and potential trend reversals.
How traders use it
One common approach is to wait for the MACD signal line to cross above the zero line and confirm that the histogram is supporting the bullish move.
A bearish setup follows the opposite sequence, with the signal line moving below zero and the histogram confirming negative momentum.
For earlier entries, the histogram can be monitored before the zero-line crossover occurs.
A shift from bearish to bullish histogram behavior may indicate that selling pressure is declining.
The strongest setups generally occur when this momentum improvement appears near established support and price subsequently breaks a nearby resistance level.
Scalping example on M5 charts with Super Trend MTF
For M5 scalping, the 3 Color MACD can be combined with the Super Trend MTF with Alerts Indicator for MT5.
Use the Super Trend to establish the prevailing direction and the MACD histogram to identify momentum entries.
On fast-moving currency pairs or gold, a disciplined setup can target approximately 12 to 30 pips, although the actual opportunity depends on volatility, spread and market conditions.
Another technique is divergence. If price makes a higher high while MACD momentum makes a lower high, bullish momentum may be weakening.
The reverse relationship can warn of declining buying pressure.
Get Instant Free Access
Indicator Settings
- FastEMA: Defines the fast moving-average period used in the MACD calculation.
- SlowEMA: Defines the slower moving-average period used to calculate MACD momentum.
- SignalSMA: Controls the period used for the MACD signal line.
- Colors: Controls the colors used for the histogram and signal components.
- Style: Controls the visual presentation of the indicator elements.
Important Notes
- A histogram color change indicates a momentum shift, not a guaranteed reversal.
- Zero-line crossovers can occur after a substantial portion of a move has already developed.
- Use price action and key market levels to filter weak crossover signals.
- On M5 charts, spread and short-term volatility can significantly affect trade quality.
- Risk management should determine the stop loss and position size for every setup.









