
The Fibo Pivot V2 Indicator for MT5 combines pivot points with Fibonacci extension levels to create a practical framework for intraday price analysis.
The central Pivot level provides the main directional reference, while three support and three resistance levels mark potential areas where price can accelerate, pause or reverse.
The indicator is particularly useful from M5 through H1, where intraday price movement often interacts with clearly defined support and resistance zones.
The combination of pivot levels and Fibonacci-based targets makes it possible to plan both the entry and potential exit before opening a position.
Fibo Pivot V2 can be used for breakout trading, trend continuation and short-term swing setups.
The levels can also be combined with price action, moving averages, RSI or Stochastic to obtain additional confirmation before entering a position.
Why traders use Fibo Pivot V2
The main advantage of Fibo Pivot V2 is that it gives the chart a predefined set of price levels.
Rather than searching manually for every potential support and resistance area, the Pivot, R1-R3 and S1-S3 levels provide a framework for analyzing where price may react.
The three Fibonacci-based zones are particularly useful for profit management.
R1, R2 and R3 can become successive upside objectives during a bullish move, while S1, S2 and S3 can provide downside targets during a bearish move.
This makes the indicator useful when the market breaks away from consolidation.
A candle closing above the Pivot can support a bullish interpretation, while a sustained move below it can shift attention toward the downside levels.
Download This MT5 Indicator for Free
Indicator Chart Setup
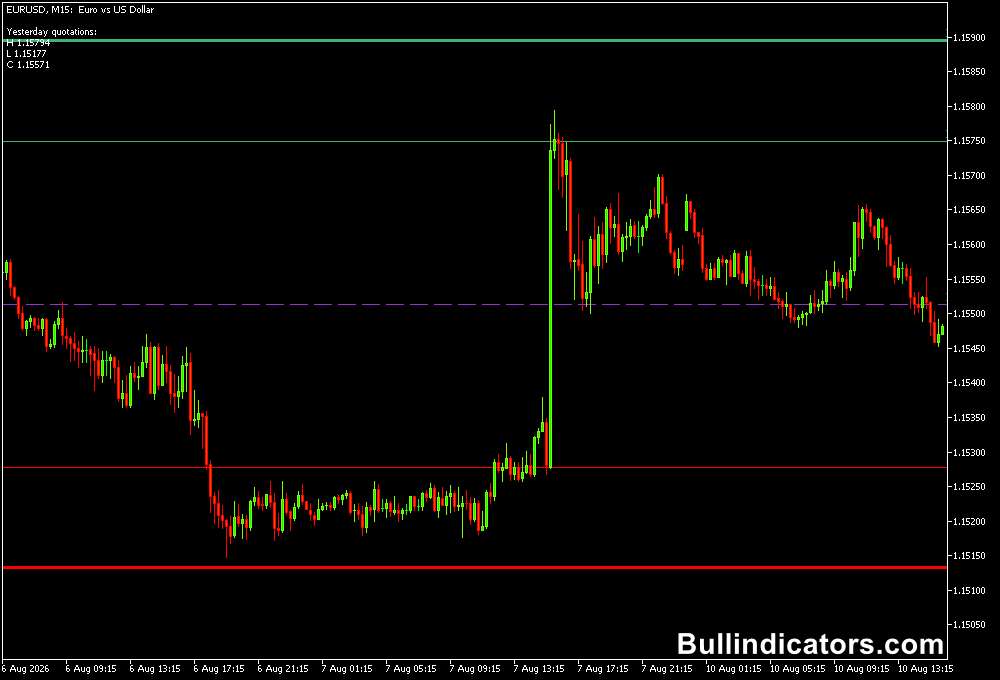
Fibo Pivot V2 displays a central Pivot line together with three resistance levels above it and three support levels below it.
The levels are based on Fibonacci calculations corresponding to approximately 38%, 50% and 62% extensions around the central pivot area.
The result is a simple price map.
When price is above the Pivot, the resistance levels provide potential upside objectives.
When price is below the Pivot, the support levels become the primary downside references.
Core Features
- Combines pivot-point analysis with Fibonacci-based levels.
- Displays a central Pivot level for directional analysis.
- Provides three resistance levels: R1, R2 and R3.
- Provides three support levels: S1, S2 and S3.
- Useful for identifying intraday breakout areas.
- Provides predefined areas for potential take-profit targets.
- Suitable for M5, M15, M30 and H1 trading.
- Line styles, widths and colors can be customized.
Best for
- Intraday breakout trading around the Pivot level.
- Identifying potential continuation targets after a breakout.
- Planning stop-loss locations around recent market highs and lows.
- Mapping support and resistance before an active trading session.
- Short-term swing trades where multiple Fibonacci targets can be used for position management.
Best Markets
- GBPJPY: Particularly suitable for M5 to H1 because its intraday range can provide room between the pivot levels.
- GBPUSD: Useful for London-session breakout setups and continuation trades.
- EURUSD: Well suited to structured intraday analysis around daily pivot levels.
- USDJPY: Can provide clean reactions around pivot levels during active Asian and US sessions.
- XAUUSD: The wider intraday movement can make the R2/R3 and S2/S3 levels useful as extended targets.
Trading Styles
- Scalping: M5 and M15 can be used for quick breakout trades around the Pivot and R1/S1.
- Intraday breakout trading: M15 and M30 provide a balance between signal frequency and market noise.
- Trend following: M30 and H1 can be used when price establishes a sustained direction beyond the Pivot.
- Short-term swing trading: H1 can be used to target R2/R3 or S2/S3 after a confirmed directional move.
- Session trading: M15 is useful for combining the pivot levels with London or New York market activity.
How traders use it
The Pivot level is the starting point for directional analysis. A bullish setup develops when price breaks above the Pivot and a candle closes above it.
Confirmation is stronger when the breakout occurs with increasing momentum and price remains above the level during subsequent candles.
For a long position, the recent market low can provide a logical stop-loss reference.
R1 becomes the first potential target, followed by R2 and R3 if the market continues to accelerate.
Partial profit-taking can be used at the earlier levels while leaving part of the position open for a larger move.
The bearish approach is the reverse.
A candle closing below the Pivot can indicate that sellers have gained control.
A short position can then be considered after confirmation, with the recent market high providing a potential stop-loss reference. S1, S2 and S3 become successive downside objectives.
A useful rule is to seek at least 2R potential before entering.
For example, if the planned risk is 20 pips, the first meaningful target should ideally offer around 40 pips or more.
This helps prevent trades where the distance to the next pivot level is too small compared with the required stop.
GBPJPY M15 Buy Example
- Price trades below the Pivot during the early part of the session.
- GBPJPY then pushes upward and closes an M15 candle above the Pivot.
- The following candle holds above the Pivot instead of immediately falling back below it.
- Consider a buy after bullish confirmation, particularly if the move is supported by strong price momentum.
- Place the stop below the recent M15 swing low or below the breakout structure.
- R1 becomes the first profit target, with R2 available as a second objective if momentum remains strong.
- If price reaches R1 quickly and continues making higher lows, part of the position can remain open toward R2.
GBPJPY M15 Sell Example
- Price approaches the Pivot from above but fails to maintain bullish momentum.
- An M15 candle closes below the Pivot, establishing a bearish breakout.
- Wait for the next candle to confirm that price is not immediately reclaiming the Pivot.
- Consider a short position after bearish confirmation.
- Place the stop above the recent swing high or above the failed breakout area.
- S1 becomes the first downside target, while S2 can be used if selling pressure continues.
- If price reaches S1 and begins forming strong bullish rejection, consider reducing the position rather than expecting an automatic continuation toward S2.
Get Instant Free Access
Indicator Settings
-
- Line Style of the R3 Level: Selects the visual style of the Resistance 3 line.
- Line Style of the R2 Level: Selects the visual style of the Resistance 2 line.
- Line Style of the R1 Level: Selects the visual style of the Resistance 1 line.
- Line Style of the P Level: Selects the visual style of the central Pivot line.
- Line Style of the S3 Level: Selects the visual style of the Support 3 line.
Important Notes
- The Pivot is a reference level, not an automatic buy or sell signal.
- Wait for the candle to close beyond the Pivot before treating a breakout as confirmed.
- False breakouts can occur when price quickly moves above or below the Pivot and then returns through it.
- M5 charts can produce more signals but also contain more short-term market noise.
- M15 and M30 often provide a useful balance between entry frequency and signal quality.
- H1 is useful for larger intraday moves where R2/R3 or S2/S3 can become realistic targets.
- Risk should be calculated before entering, with the stop-loss distance considered against the available Fibonacci target.
- Aim for setups offering at least 2R potential rather than entering simply because price touches a pivot level.
Fibo Pivot V2 provides a straightforward way to combine pivot-point analysis with Fibonacci-based price targets.
It is particularly effective on M5 through H1 charts, where the predefined levels can be used to organize breakout entries, stop-loss placement and profit objectives.
For the best results, treat the levels as areas for analysis and wait for price confirmation before committing capital.
A strong breakout beyond the Pivot, followed by continued momentum toward R1-R3 or S1-S3, creates the type of structured setup this indicator is designed to identify.









