
The ADXVMA Histogram indicator for MT5 combines the Average Directional Index (ADX) with a Variable Moving Average (VMA) to evaluate two important aspects of market behavior: trend direction and trend strength.
The result is a histogram oscillator that makes directional changes easier to monitor while the ADX component helps assess whether the current move has sufficient strength.
The histogram uses changing colors to indicate the prevailing direction.
Green bars identify bullish conditions, while red bars indicate bearish pressure.
This makes the indicator useful for spotting trend transitions, momentum changes and potential continuation setups across Forex, indices, metals, commodities and stocks.
Why traders use the ADXVMA Histogram Indicator
The main advantage of the ADXVMA combination is that direction and trend strength can be evaluated together.
A conventional moving average can help determine whether price is moving higher or lower, but it does not directly measure the strength of that movement.
ADX adds this additional dimension to the analysis.
A green histogram can therefore be used as a bullish directional signal, while a red histogram provides a bearish indication.
The ADX component can then help determine whether the underlying trend has enough strength to justify staying with the position.
This combination is particularly useful when a market changes from consolidation into a directional move.
It can also be used with another trend filter to reduce signals that occur against the broader market direction.
Download This MT5 Indicator for Free
Indicator Chart Setup
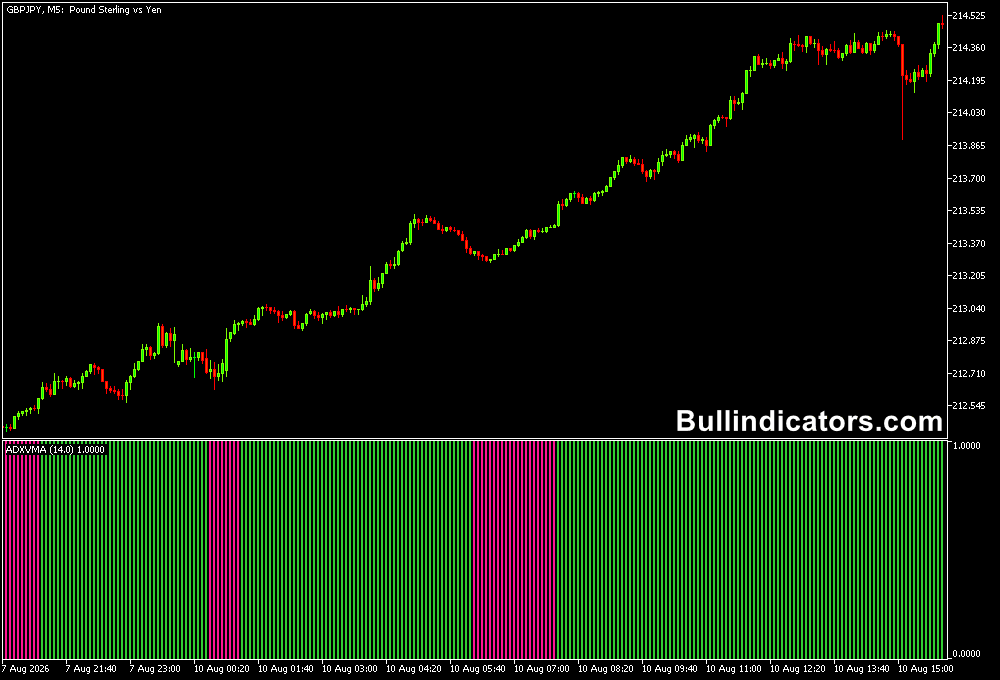
The ADXVMA Histogram appears in a separate indicator window below the MT5 price chart.
The histogram represents the directional relationship between the D+ and D- components, replacing the traditional directional lines with a more visual display.
Green bars indicate bullish conditions and red bars indicate bearish conditions.
The ADX line provides additional information about trend strength.
Stronger ADX readings can support continuation trades, while declining ADX values may warn that the current directional move is losing momentum.
Core Features
- Combines ADX trend-strength analysis with VMA directional analysis.
- Green histogram bars identify bullish conditions.
- Red histogram bars identify bearish conditions.
- ADX line helps assess trend strength and potential weakening.
- Can be used for trend changes, continuation setups and divergence analysis.
- Suitable for multiple timeframes and asset classes.
Best for
- Identifying changes in directional momentum.
- Filtering trend-following entries by market strength.
- Monitoring potential trend exhaustion.
- Combining directional signals with moving-average confirmation.
- Developing multi-timeframe trading strategies.
Best Markets
- GBPUSD: Suitable for intraday trend setups where directional moves develop during London and New York sessions.
- EURUSD: Useful for M15 and H1 trend-following strategies.
- USDJPY: Can be applied to session-based directional moves on M15 and H1.
- Gold (XAUUSD): Useful for monitoring strong directional phases during periods of increased volatility.
- Major stock indices: Suitable for identifying sustained directional moves on M15, H1 and H4 charts.
Trading Styles
- M5 scalping: Use a higher-timeframe EMA as a directional filter and take only aligned histogram signals.
- M15 intraday trading: Combine histogram color changes with ADX strength to identify continuation setups.
- H1 trend trading: Give greater weight to sustained histogram color and rising trend strength.
- H4 swing trading: Use directional changes to identify larger market moves and potential trend transitions.
How traders use it
A basic bullish setup occurs when the histogram changes to green. A bearish setup develops when the histogram changes from green to red.
These color transitions provide the directional component of the strategy, but the ADX reading should also be considered before entering a position.
Example with the EMA MT5 Indicator
For a more selective approach, the ADXVMA Histogram can be combined with the EMA Indicator for MT5.
The EMA acts as the primary price-direction filter.
When a candle is trading above the EMA, only bullish ADXVMA signals are considered.
When price is below the EMA, only bearish signals are considered.
GBPUSD Example
For example, consider GBPUSD on the M15 chart.
If price is trading above the EMA and the ADXVMA histogram changes from red to green, a possible buy entry can be considered after the bullish candle closes.
A practical example would be an entry at 1.3450 with a stop loss at 1.3425, giving 25 pips of initial risk.
The position could then be managed toward the next resistance area or closed when the histogram changes back to red.
For a sell setup, the conditions are reversed.
If GBPUSD is below the EMA and the ADXVMA histogram turns red, a sell entry could be considered after confirmation from the closing candle.
The stop should be positioned according to the recent swing high, market volatility and the chosen risk level rather than using a fixed distance on every trade.
Get Instant Free Access
Indicator Settings
- Period: Sets the calculation period used for the Directional Movement Index.
- Price: Determines the price data used for the indicator calculation, with median bar prices available.
- Colors: Controls the visual colors of the histogram and indicator elements.
- Style: Controls the visual presentation of the indicator.
Important Notes
- A histogram color change is a directional signal, not a guarantee of a new trend.
- Use the ADX component to judge whether the directional move has meaningful strength.
- The EMA filter can help reduce trades taken against the broader price direction.
- On lower timeframes, avoid relying on a single histogram change without considering price action and volatility.
- For multi-timeframe strategies, use the higher timeframe to establish direction and the lower timeframe to refine entries.









