
The Buy Sell Volume indicator for MT5 measures the balance between bullish and bearish volume pressure and displays the result through colored lines and a histogram.
It is designed to help determine whether a price move is supported by increasing buying or selling activity.
Volume can be particularly useful when analyzing breakouts and established trends.
A price move accompanied by increasing bullish volume has different characteristics from a rally that develops while buying pressure is fading.
The same principle applies to bearish moves.
The indicator does not generate a simple automatic buy or sell instruction.
Its primary role is to provide volume confirmation that can be combined with price action, trend analysis and other indicators.
This makes it useful for filtering setups rather than entering every time the histogram changes direction.
Why traders use the Buy Sell Volume Indicator
The indicator provides a visual comparison between bullish and bearish market pressure.
Green readings indicate increasing buying volume, while orange readings indicate increasing selling volume.
The histogram adds another way to judge whether volume is expanding in the current direction.
This becomes particularly valuable around consolidation zones.
When price remains trapped within a relatively narrow range, an increase in bullish volume as price approaches resistance can suggest that buyers are becoming more active.
If price subsequently breaks the range while the green volume reading continues to rise, the breakout has stronger volume confirmation.
The same process can be applied to bearish breakouts.
Increasing orange volume during a break below support can indicate that sellers are participating in the move rather than price simply making a temporary move through the level.
Download This MT5 Indicator for Free
Indicator Chart Setup
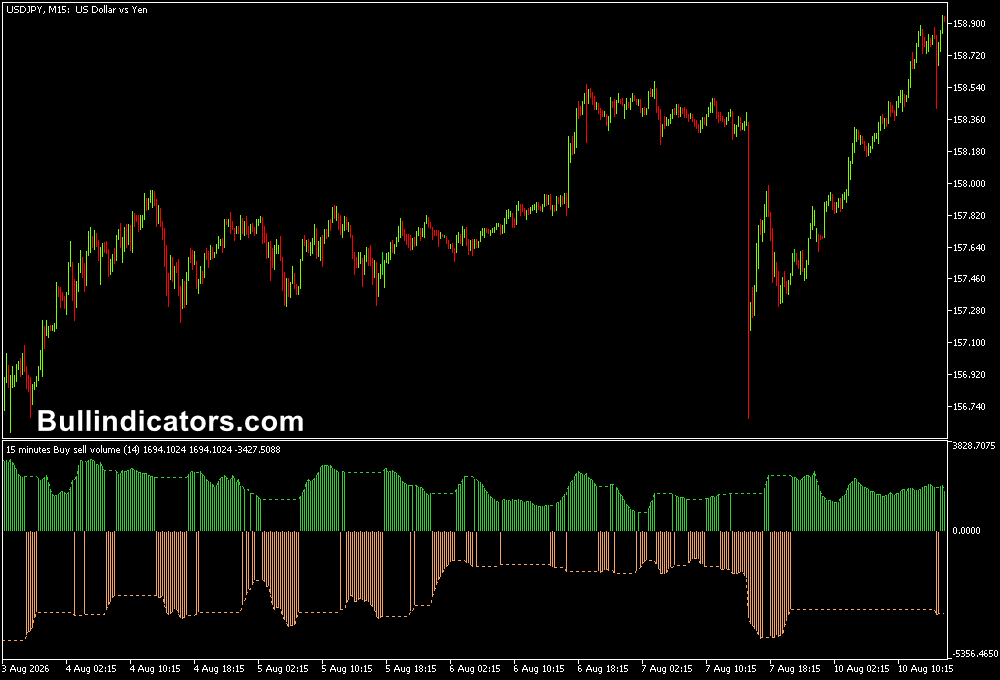
The Buy Sell Volume indicator is displayed in a separate window below the price chart.
Two colored lines track the volume conditions, while a histogram between the lines provides additional visual confirmation.
Green histogram bars and an upward-moving green volume line indicate increasing bullish pressure.
Orange histogram bars combined with a declining orange line indicate increasing bearish pressure.
When the readings remain relatively flat, the market may lack strong directional volume.
Core Features
- Measures relative bullish and bearish volume pressure.
- Displays separate green and orange volume readings.
- Uses a histogram to visualize changes in volume strength.
- Can help confirm breakouts from consolidation ranges.
- Useful for assessing trend continuation.
- Supports current-timeframe and selectable timeframe calculations.
- Allows real volume or tick volume to be selected.
- Includes smoothing options for the indicator lines.
Best for
- Confirming whether breakouts have supporting volume.
- Identifying increasing buying pressure during bullish trends.
- Detecting growing selling pressure during bearish moves.
- Filtering weak price movements with limited volume participation.
- Finding continuation opportunities after a pullback.
- Combining volume information with a separate trend filter.
Best Markets
- EURUSD: Particularly useful during London and New York when liquidity and directional movement increase.
- GBPUSD: Well suited to breakout analysis around major London-session levels.
- USDJPY: Useful for monitoring volume confirmation during the Asian and US sessions.
- GBPJPY: Its larger intraday ranges can provide strong volume expansion during active sessions.
- XAUUSD: Can be useful for identifying whether aggressive moves are accompanied by increasing market participation.
- US indices: The indicator can also be applied to liquid indices when analyzing strong US-session momentum.
Trading Styles
- Scalping: M5 and M15 can be used to confirm short-term breakouts during the most active sessions.
- Intraday trading: M15 and H1 provide a useful combination of price structure and volume analysis.
- Breakout trading: Look for volume expansion in the same direction as the break through support or resistance.
- Trend following: H1 and H4 can help identify whether a developing trend is supported by sustained volume pressure.
- Pullback trading: Wait for price to retrace while volume weakens, then look for volume expansion when the main trend resumes.
How traders use it
The most effective approach is to compare the volume reading with what price is actually doing.
Rising green volume during a bullish breakout is more meaningful when price is also closing above resistance.
Likewise, increasing orange volume becomes more relevant when the price breaks below established support.
The indicator can also be used during a trend.
If EURUSD is making higher highs and higher lows while the green volume line continues rising, the volume reading supports the bullish trend. I
f price continues rising but bullish volume starts weakening, this can warn that momentum is becoming less convincing.
Trading example with the ADXVMA indicator
One useful combination is the ADXVMA Histogram Indicator for MT5.
This adds a directional trend filter to the volume analysis.
Green bars indicate bullish conditions, while red bars indicate bearish conditions.
Buy Setup: Buy Sell Volume + ADXVMA Histogram
- Wait for price to establish a bullish structure or break above a significant resistance level.
- The Buy Sell Volume histogram should turn green and preferably move upward, showing increasing buying pressure.
- The green volume line should support the bullish move rather than declining sharply.
- The ADXVMA Histogram should display green bars, confirming bullish conditions.
- Consider a long entry after the price breakout or after a bullish pullback holds above the broken resistance.
- Place the stop below the recent swing low or below the breakout structure.
- Use the next resistance level or a minimum 2R target as the initial profit objective.
Sell Setup: Buy Sell Volume + ADXVMA Histogram
- Wait for price to establish bearish structure or break below an important support level.
- The Buy Sell Volume histogram should turn orange and preferably move downward.
- The orange volume line should also decline, indicating increasing selling pressure.
- The ADXVMA Histogram should display red bars, confirming bearish conditions.
- Consider a short entry after the support break or following a bearish retest of the broken level.
- Place the stop above the recent swing high or failed-breakout area.
- Use the next support level or a minimum 2R target for profit management.
Why the Setup Works Well During Active Sessions
This combination can work particularly well during the most active Forex sessions because breakouts and directional moves are more likely to receive stronger participation.
London and New York are especially useful periods to monitor because major currency pairs often experience increased liquidity and larger intraday movements.
For example, a EURUSD breakout during the quieter Asian session may initially have limited participation.
If the same level is broken during London with green volume expansion and green ADXVMA bars, the move has additional confirmation.
A similar principle applies to New York when US market activity increases.
Get Instant Free Access
Indicator Settings
- Time Frame: Selects the timeframe used for the volume calculation or allows the current timeframe to be used.
- Smoothing Period: Sets the calculation period used to smooth the indicator lines.
- Smoothing Method: Selects the method used to smooth the volume readings.
- Volume to Use: Allows a choice between real volume and tick volume, depending on the available market data.
- Colors: Controls the visual colors used for the indicator components.
Important Notes
- The indicator measures volume pressure and does not provide a guaranteed directional signal.
- Rising volume is most useful when it agrees with price structure and the direction of the breakout.
- Low-volume breakouts deserve additional caution because price can quickly return inside the previous range.
- Tick volume can be useful in Forex, where centralized exchange volume is not available in the same way as centralized markets.
- Different instruments have different volume characteristics, so settings may require adjustment.
- Combining volume with the ADXVMA trend filter can reduce signals that conflict with the broader market direction.
- Always define the stop-loss before entering a position, particularly when trading during volatile session openings.









