
The Butterfly Pattern Indicator for MT4 is designed to automatically detect Butterfly harmonic formations and highlight potential reversal areas on the price chart.
The pattern is built around a four-wave structure consisting of X, A, B, C, and D points, with the final leg helping define a potential turning zone.
Manual harmonic analysis can take considerable time because each swing must be measured and compared against specific Fibonacci relationships.
This tool performs that scanning automatically and displays detected formations with bullish or bearish signals, giving you a practical starting point for further analysis.
Why traders use the Butterfly Pattern Indicator
The main advantage is automated pattern recognition.
Rather than searching through historical price swings manually, the tool continuously monitors market movement and identifies formations that meet its detection parameters.
It can be useful for both reversal and continuation analysis, particularly when the detected pattern is supported by the prevailing trend, a significant support or resistance level, or confirming price action.
The signals can also be combined with another market-direction tool to filter weaker setups.
Download This MT4 Indicator for Free
Indicator Chart Setup
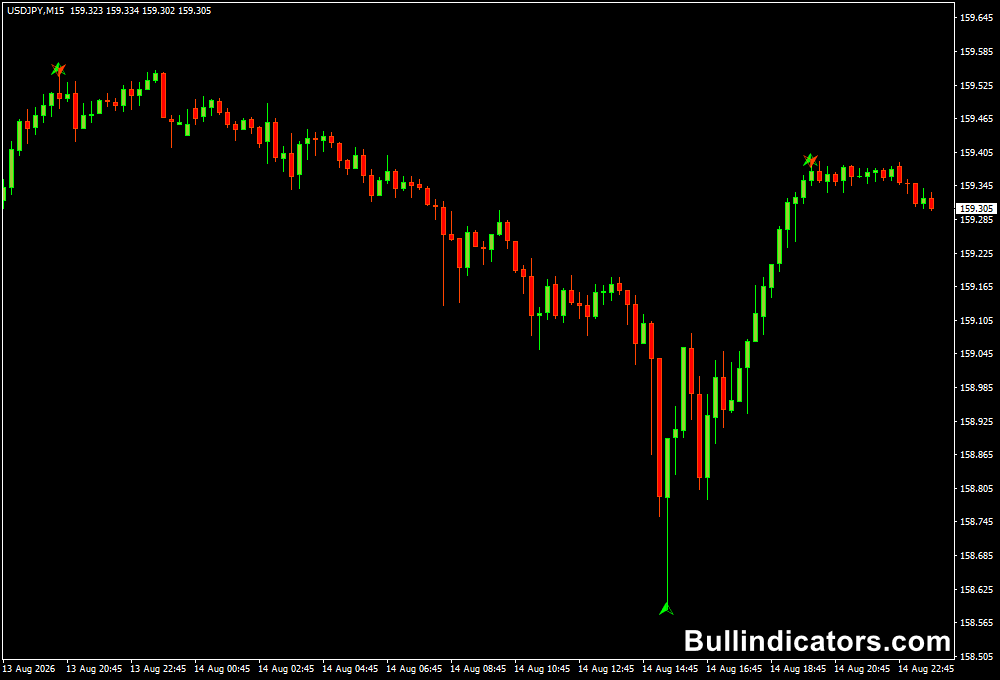
When applied to an MT4 chart, the Butterfly Pattern Indicator scans the price swings and marks detected bullish or bearish formations.
The harmonic legs and pattern points help show how the formation developed, while directional arrows can highlight areas where a potential buy or sell setup may be developing.
Core Features
- Automatic Butterfly harmonic pattern detection.
- Bullish and bearish pattern recognition.
- Buy and sell arrows for detected setups.
- Adjustable swing sensitivity and deviation.
- Works across multiple MT4 timeframes.
- Useful for identifying potential reversal zones.
Best for
- Spotting potential harmonic reversals.
- Confirming price swings around key levels.
- Finding intraday reversal opportunities.
- Combining harmonic patterns with trend analysis.
Best Markets
- EURUSD and GBPUSD for liquid London-session setups.
- GBPJPY and EURJPY for larger intraday price swings.
- XAUUSD when stronger volatility produces well-defined formations.
- Major forex pairs during the London and New York sessions.
Trading Styles
- Intraday trading on M15 and H1 charts.
- Swing trading using H4 and D1 formations.
- Reversal trading around major support and resistance.
- Multi-timeframe analysis for higher-quality setups.
How traders use it
A practical approach is to first determine the direction of the main trend.
Only consider bullish Butterfly setups when the broader market supports long positions, and bearish formations when the dominant trend supports short positions.
This trend filter can help avoid taking every reversal signal produced during strong directional movement.
The Butterfly Pattern Indicator can also be combined with the Vortex Indicator for MT4.
How does it work
The simplest approach is to monitor which Vortex line is positioned above the other.
When V+ crosses above V-, the market develops a bullish bias and a long setup can be considered.
When V- crosses above V+, the bias turns bearish and a short setup can be evaluated.
For example, a bullish Butterfly formation can be given greater attention when V+ is above V-, while a bearish formation can receive additional confirmation when V- is dominant.
Price action around the pattern completion area should still be assessed before entering a position.
Get Instant Free Access
Indicator Settings
- ExtDepth: Controls the sensitivity used when detecting significant price swings.
- ExtDeviation: Sets the deviation threshold used in relation to market volatility.
- Colors: Allows the visual appearance of the plotted pattern elements and signals to be adjusted.
Important Notes
- Always trade in the direction of the main market trend whenever possible.
- A Butterfly formation should be treated as a setup area rather than an automatic entry.
- Confirm reversal signals with price action, support and resistance, or a complementary tool.
- Higher timeframes can produce more significant harmonic formations but fewer signals.
- Very low timeframes may generate more setups while also producing more market noise.
- Use appropriate stop-loss placement based on the pattern structure and current volatility.









