
The AO Divergence Indicator for MT4 expands the traditional Awesome Oscillator with automatic divergence detection and directional signals.
It compares fast and slow Simple Moving Averages to evaluate changes in momentum, while the histogram provides a visual representation of whether buying or selling pressure is gaining strength.
One of its main advantages is the automatic identification of divergences.
Rather than manually comparing every swing high and low with oscillator movements, the tool draws divergence lines directly on the chart and adds arrows around potential trading areas.
This makes it useful for both momentum analysis and spotting situations where an established trend may be losing strength.
Why traders use the AO Divergence Indicator
Divergence can be difficult to monitor consistently, especially when several markets and timeframes are being analyzed.
AO Divergence handles much of that comparison automatically, highlighting differences between price movement and oscillator momentum.
The histogram adds another layer of information.
Green bars indicate bullish momentum, while red bars indicate bearish momentum.
The zero line provides an additional trend reference, with a move above zero suggesting strengthening bullish momentum and a move below zero indicating increasing bearish pressure.
This combination makes the tool suitable for trend continuation analysis as well as reversal setups.
The strongest signals generally occur when the divergence, histogram behavior, and broader market direction point toward the same outcome.
Download This MT4 Indicator for Free
Indicator Chart Setup
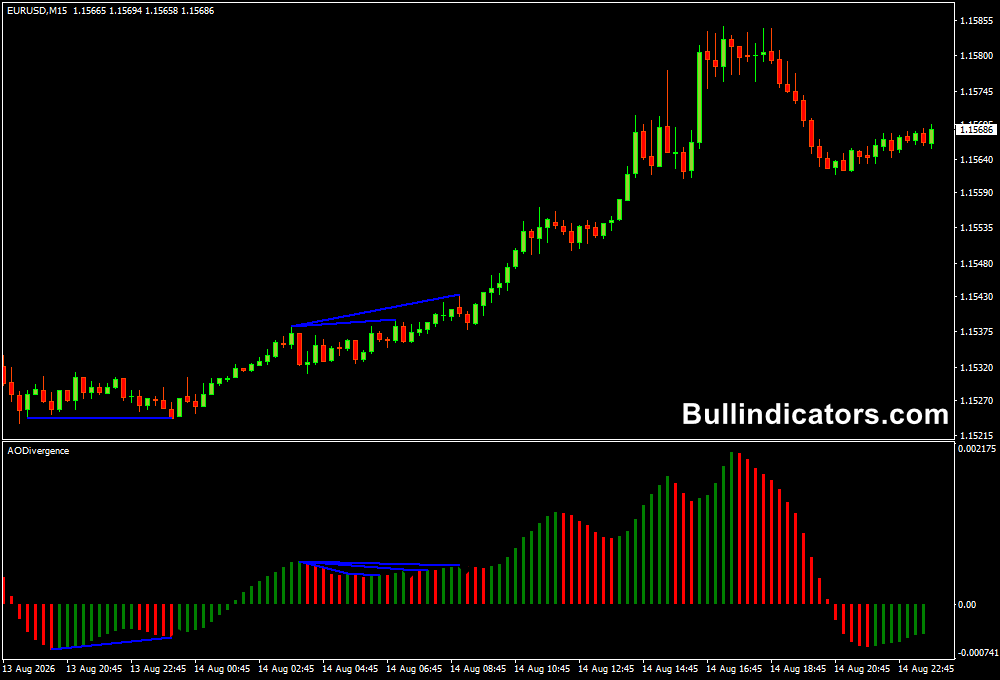
The AO histogram is displayed in a separate window beneath the main price chart.
Green and red bars show changes in momentum, while the zero level provides a reference for the broader oscillator direction.
Blue divergence lines are plotted when the relationship between price and oscillator movement suggests a potential momentum discrepancy.
Directional arrows can then highlight possible buy and sell areas, giving you several pieces of information to evaluate before entering a position.
Core Features
- Based on fast and slow Simple Moving Averages.
- Automatically identifies bullish and bearish divergences.
- Draws divergence lines for easier analysis.
- Displays green and red momentum histogram bars.
- Provides directional buy and sell arrows.
- Uses the zero line as an additional momentum reference.
Best for
- Detecting momentum divergence before potential reversals.
- Confirming the strength of an existing trend.
- Identifying changes around the oscillator zero line.
- Finding pullback and reversal opportunities.
- Combining momentum analysis with price-action confirmation.
Best Markets
- EURUSD for structured intraday movements around major session levels.
- GBPUSD when momentum changes develop around London and New York sessions.
- GBPJPY for larger swings and stronger divergence formations.
- XAUUSD when rapid momentum shifts create visible oscillator extremes.
- US30 and NAS100 for traders following strong directional index movements.
- Any other currency pair should work.
Trading Styles
- Scalping on M5 and M15 when momentum signals are supported by price action.
- Intraday trading on M15 and H1 for trend and reversal setups.
- Swing trading on H4 and D1 using larger divergence formations.
- Momentum trading around zero-line transitions.
- Reversal strategies based on divergence and key market levels.
How traders use it
A useful approach is to combine the divergence signals with the broader market direction rather than taking every arrow independently.
Always trade in the direction of the main trend whenever possible, particularly when using the histogram for continuation setups.
AO Divergence Buy Rules
- Confirm that the broader market is bullish or beginning to turn upward.
- Look for bullish divergence between price and the AO histogram.
- Wait for the histogram to strengthen and preferably move above the zero line.
- Look for a bullish arrow or upward price-action confirmation.
- Enter a buy after the bullish setup has been confirmed.
- Place the stop loss below the relevant swing low or invalidation area.
- Target the next resistance level or use a predefined risk-to-reward objective.
AO Divergence Sell Rules
- Confirm that the broader market is bearish or starting to weaken.
- Look for bearish divergence between price and the AO histogram.
- Wait for bearish momentum to increase and preferably move below zero.
- Look for a bearish arrow or confirming price-action pattern.
- Enter a sell once the bearish conditions align.
- Place the stop loss above the relevant swing high.
- Target the next support area or a predefined risk-to-reward objective.
Zero-Line Momentum Strategy
The zero line can be used independently from divergence.
When the histogram crosses above zero, bullish momentum is gaining control and long setups can be considered if the price trend agrees.
A move below zero indicates increasing bearish momentum and can support short setups when other conditions align.
Divergence Reversal Strategy
For a bullish reversal, look for price to establish a lower low while the AO histogram forms a higher low.
This suggests that selling pressure is weakening. For a bearish reversal, price can create a higher high while the histogram forms a lower high.
In both cases, wait for price confirmation before treating the divergence as an actionable setup.
Get Instant Free Access
Indicator Settings
- fastMA: Sets the period of the faster Simple Moving Average used in the AO calculation. The default value is 5.
- slowMA: Sets the period of the slower Simple Moving Average. The default value is 34.
- isshowsignaltype1: Controls the first available signal type displayed by the tool.
- isshowsignaltype2: Controls the second signal type displayed by the tool.
- divergencebars: Determines the number of bars used when plotting divergence formations. The default value is 4.
Important Notes
- Always consider the main market trend before trading divergence signals.
- Divergence indicates a potential momentum change, not a guaranteed reversal.
- Sideways markets can produce weaker or conflicting signals.
- Wait for candle confirmation when trading reversal formations.
- A zero-line crossover is more useful when supported by price structure and market direction.
- Higher-timeframe divergences can carry greater significance but may take longer to develop.
- Use appropriate stop-loss placement and risk management on every setup.









