
The Breakout Zones indicator for MT4 automatically marks important support and resistance areas based on recent price movement.
These levels provide reference points for identifying potential breakouts, planning entries, and managing existing positions.
Breakout trading can be particularly effective when price has spent time consolidating around a defined range.
A decisive move beyond resistance can signal increasing buying pressure, while a confirmed break below support may indicate growing selling pressure.
The key is to wait for confirmation rather than reacting to every temporary move through a level.
Why traders use the Breakout Zones Indicator
Manually identifying important breakout areas on several currency pairs can take considerable time.
This tool automatically plots the relevant zones on the chart, allowing you to focus more attention on how price behaves around those levels.
The zones can be useful for both continuation and breakout strategies.
A strong close beyond resistance may provide a bullish setup, while a close below support can create a bearish opportunity.
Previous swing points, market volume, and a separate trend filter can then be used to strengthen the trade decision.
Breakouts can also be used to manage existing positions.
For example, a trader holding a long position may monitor a newly formed resistance zone as a potential profit area or warning that momentum is slowing.
Download This MT4 Indicator for Free
Indicator Chart Setup
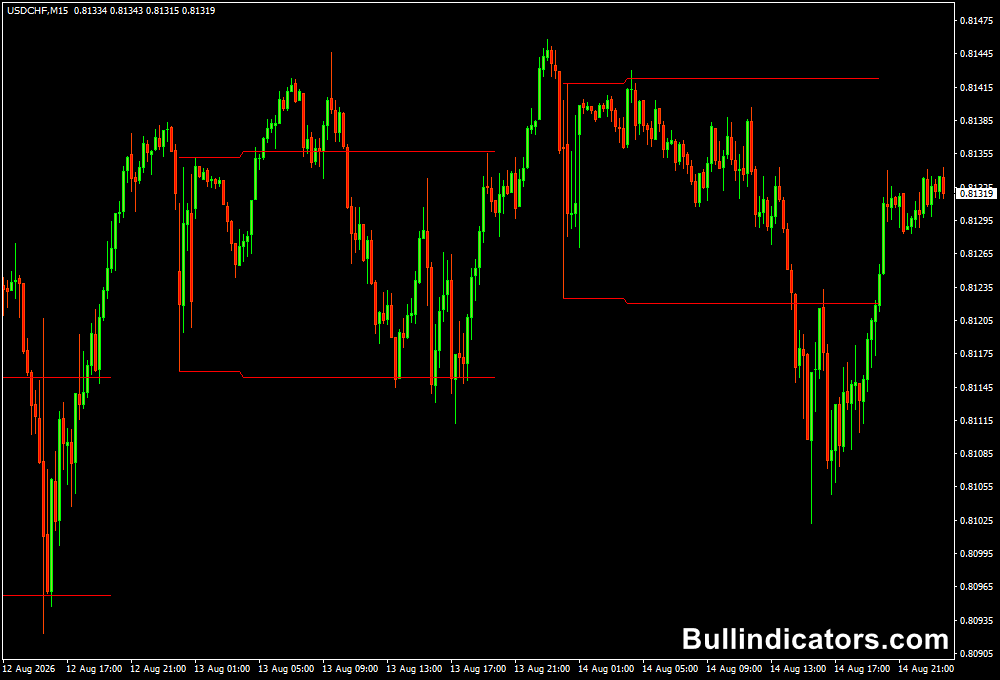
The chart displays automatically calculated support and resistance lines around the active price area.
These levels form the breakout zone that can be monitored during the trading session.
When price approaches resistance, watch for a strong bullish close above the level.
When price reaches support, look for either a confirmed downside break or a rejection that could lead to a move back through the range.
Core Features
- Automatically plots support and resistance levels.
- Highlights potential breakout areas on the price chart.
- Works across intraday MT4 timeframes.
- Provides an easy reference for breakout entries.
- Includes an adjustable entry-pip parameter.
- Useful for both breakout and range-based analysis.
Best for
- Identifying potential breakout levels before major price moves.
- Monitoring consolidation ranges.
- Planning entries after confirmed support or resistance breaks.
- Combining breakout levels with price-action confirmation.
- Managing positions around important market zones.
Best Markets
- GBPUSD during the London session when range expansion can create strong intraday moves.
- EURUSD around major session highs and lows.
- USDJPY for breakouts from Asian-session ranges.
- GBPJPY for traders comfortable with larger intraday movements.
- XAUUSD when significant volatility creates rapid breaks of established levels.
Trading Styles
- Scalping on M5 and M15 breakout setups.
- Intraday trading using M15, M30, and H1 zones.
- London-session range breakouts.
- New York breakout strategies.
- Swing trading when major H4 levels are breached.
How traders use it
A reliable breakout approach starts with the level rather than the entry.
Wait for price to approach the zone, observe the reaction, and only consider the trade after the breakout candle has closed.
Buy Example
- Open GBPUSD on an M15 or M30 chart.
- Identify the resistance line created by the Breakout Zones Indicator.
- Wait for price to approach and test the resistance.
- Look for a strong bullish candle to close above the resistance level.
- Confirm that the move is supported by bullish price action or your preferred trend filter.
- Enter a buy after the breakout candle closes.
- Place the stop loss below the recent swing low or below the breakout zone, depending on volatility.
- Target the next major resistance level while maintaining a risk-to-reward ratio of at least 1:2 where market conditions allow.
Sell Example
- Locate the support line on GBPUSD M15 or M30.
- Wait for price to test the support area.
- Allow a bearish candle to close below the support level.
- Check for additional bearish price-action confirmation.
- Enter a sell after the confirmed close.
- Place the stop loss above the latest swing high or breakout area.
- Use the next significant support level as a potential profit objective.
- Avoid entering if price quickly returns inside the original zone after the break.
Get Instant Free Access
Indicator Settings
- LocalTimeZone: Sets the local time zone used by the trading terminal.
- DestTImeZone: Defines the broker’s destination time zone.
- PipsForEntry: Determines the number of pips used when marking the potential entry point.
Important Notes
- Wait for the breakout candle to close before entering a position.
- A temporary move beyond support or resistance can become a false breakout.
- Use price action, trend direction, or volume as additional confirmation.
- Do not assume every breakout will develop into a sustained trend.
- Stop-loss placement should account for the current market volatility.
- Use nearby swing levels and support or resistance to establish realistic profit targets.
- Breakout strategies generally perform better when sufficient market activity supports the move.









