
The Breakout indicator for MT4 automatically identifies important high and low price levels and plots them as potential breakout zones on the chart.
By tracking previous market highs and lows, it creates horizontal support and resistance levels that can be monitored for a decisive move through either boundary.
Breakout trading can be particularly effective when price has spent time consolidating before a strong directional move.
Once a significant high or low is broken with convincing price action, momentum can accelerate as more market participants react to the new direction.
Why traders use the Breakout Indicator
Identifying meaningful breakout levels manually can require constant monitoring of previous highs and lows.
This tool simplifies that process by automatically calculating the selected historical range and displaying the corresponding levels on the chart.
The settings can be adapted to different trading horizons, allowing the same concept to be used for short-term intraday breakouts or broader levels that remain relevant for several days.
The plotted boundaries also provide useful reference points for assessing whether price is approaching a potential expansion in volatility.
Download This MT4 Indicator for Free
Indicator Chart Setup
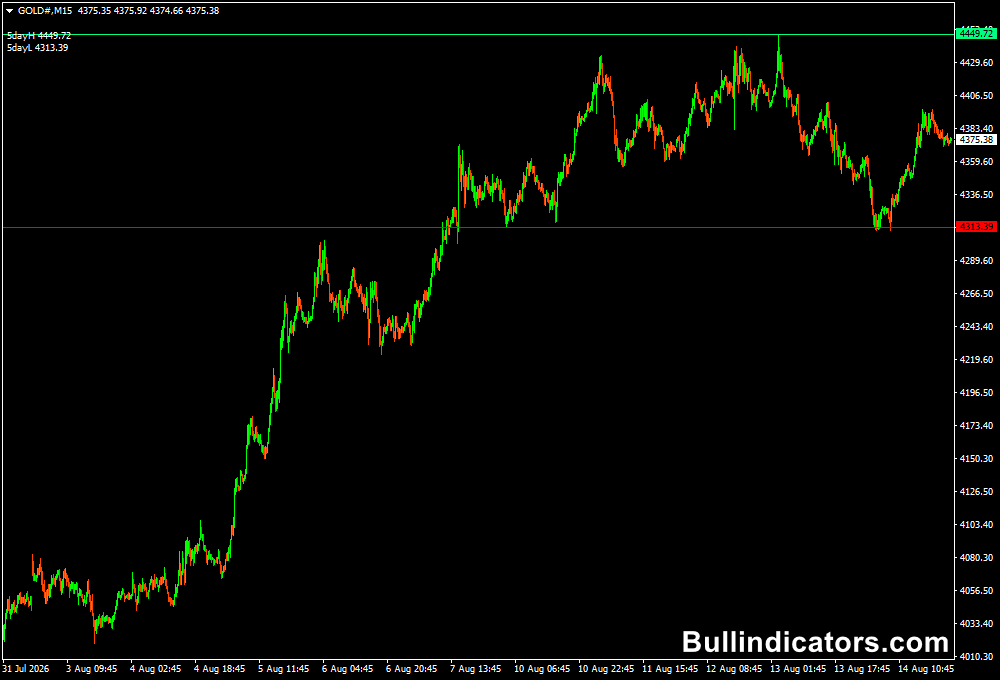
The chart displays horizontal levels based on the selected number of previous days.
By default, the calculation uses the previous five days’ high and low.
The green line marks the upper resistance level, while the red line identifies the lower support level.
A move above the upper boundary can signal a potential bullish breakout, while a move below the lower boundary can indicate bearish momentum.
The level itself is not an automatic entry signal, so confirmation from the price action is important before taking a position.
Core Features
- Automatically calculates recent market highs and lows.
- Plots potential breakout support and resistance levels.
- Allows the historical calculation period to be adjusted.
- Can be configured for daily, weekly, or monthly reference levels.
- Useful for breakout and volatility expansion strategies.
- Works across different MT4 timeframes.
Best for
- Identifying levels where price may begin a strong directional move.
- Trading breaks of established support and resistance.
- Monitoring consolidation ranges before volatility expands.
- Finding early entries during emerging trends.
- Planning breakout trades around major historical levels.
Best Markets
- EURUSD for session breakouts and major economic-event moves.
- GBPJPY when strong volatility produces rapid range expansion.
- USDJPY for directional moves around established daily levels.
- XAUUSD for traders targeting larger breakouts during London and New York sessions.
- US indices such as NAS100 and US30 when previous highs and lows are clearly respected.
Trading Styles
- Scalping on M1 and M5 around tightly defined breakout levels.
- Intraday trading using M15 and H1 breakout zones.
- Session breakout strategies around London or New York openings.
- Swing trading with H4 and D1 support and resistance levels.
- Volatility breakout strategies following periods of consolidation.
How traders use it
A straightforward method is to wait for price to approach one of the plotted boundaries and then evaluate the candle behavior around that level.
A break above resistance followed by a strong bullish close can provide evidence that buyers have taken control.
A bearish close below support can provide similar confirmation for sellers.
Buy and sell setup rules
For a buy setup, wait for price to break above the green resistance line and look for one or more bullish candles to close above the level.
The breakout should preferably show convincing momentum rather than only a temporary spike.
A stop loss can be placed below the breakout structure or a nearby swing low, with profit targeted toward the next significant resistance area or a predefined risk-to-reward level.
For a sell setup, wait for price to break below the red support line and look for a bearish candle to close below the level.
A stop can be positioned above the recent swing high or failed breakout area.
The trade can then target the next support zone or a predetermined profit objective.
Always trade in the direction of the main trend when possible.
During a strong bullish market, bullish breaks generally deserve greater attention, while bearish breaks carry more weight when the broader market is declining.
Handling False Breakouts
Not every break beyond a support or resistance level develops into a sustained move.
Price can briefly cross a boundary and then return inside the previous range.
This is why candle closes and follow-through are important.
A failed break can also become a reversal setup if price quickly returns through the level and starts moving in the opposite direction.
Get Instant Free Access
Indicator Settings
- Days: Determines how many previous days are considered when calculating the relevant highs and lows. Adjusting this value allows the tool to identify shorter-term or broader daily, weekly, and monthly breakout levels.
- Colors: Controls the colors used to display the breakout, support, and resistance levels.
- Line Style: Determines how the horizontal levels are displayed on the chart.
Important Notes
- Always consider the main market trend before trading a breakout.
- A brief move through a level can be a false breakout rather than a genuine trend move.
- Wait for convincing price action and preferably a candle close beyond the level.
- High-impact economic news can produce rapid breakouts and sharp reversals.
- Higher-period levels can be more significant but may generate fewer opportunities.
- Use appropriate risk management and place the stop loss according to the market structure.









