
The ZigZag Arrow Indicator for MT4 helps identify important swing highs and swing lows directly on the price chart.
Rather than drawing the traditional zigzag line between market turning points, it marks the detected swings with arrows, making recent price structure easier to follow.
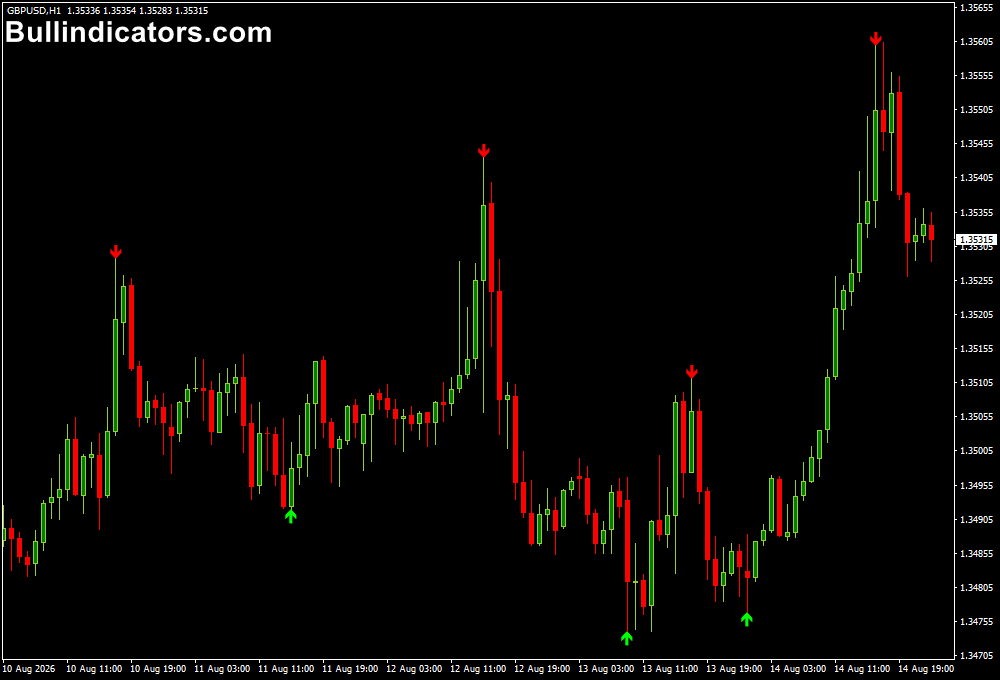
Blue upward arrows identify swing lows, while red downward arrows highlight swing highs.
These points can then be used to assess whether the market is forming higher highs and higher lows or moving through a sequence of lower highs and lower lows.
This makes the tool useful for price-action analysis, pullback trading, and locating potential reversal areas.
Why traders use the ZigZag Arrow Indicator
Market structure often becomes difficult to follow when price produces numerous small fluctuations.
The ZigZag Arrow Indicator filters these movements according to its settings and focuses attention on more significant turning points.
The swing points provide a practical framework for analyzing trend direction.
A series of higher swing highs and higher swing lows suggests bullish conditions, while lower highs and lower lows indicate bearish pressure.
The arrows can also help define areas where additional confirmation, such as candlestick patterns or support and resistance, may be useful.
For stronger setups, use the swing signals together with the broader trend and avoid treating every arrow as an automatic entry.
Download This MT4 Indicator for Free
Indicator Chart Setup
The tool places colored arrows around detected turning points on the main MT4 price chart.
Blue upward arrows mark swing lows, while red downward arrows mark swing highs.
By following the sequence of these points, you can assess the current market structure.
For example, progressively higher blue and red swing points can support a bullish interpretation, while progressively lower turning points suggest a bearish market.
Core Features
- Identifies significant swing highs and swing lows.
- Displays turning points with directional arrows.
- Helps assess higher-high and higher-low structures.
- Useful for identifying lower-high and lower-low sequences.
- Supports price-action and market-structure strategies.
- Works across multiple MT4 timeframes and currency pairs.
Best for
- Reading market structure.
- Identifying potential swing reversal areas.
- Finding pullback points within established trends.
- Locating recent highs and lows for stop-loss placement.
- Combining swing analysis with candlestick confirmation.
Best Markets
- GBPJPY for pronounced intraday swings and larger price legs.
- GBPAUD for identifying broader H1 and H4 market structure.
- EURUSD for analyzing cleaner swing sequences around major levels.
- AUDUSD for following developing trends across London and New York sessions.
- XAUUSD for mapping substantial swings during active market periods.
Trading Styles
- Scalping with M5 and M15 swing points.
- Intraday trading on M15, M30, and H1.
- Pullback trading within established trends.
- Swing trading using H4 and D1 market structure.
- Price-action strategies based on higher highs and lower lows.
How traders use it
The most useful application is to read the sequence of swing points rather than acting on one arrow in isolation.
Once the broader direction has been established, wait for price to retrace toward a recent swing area and look for additional confirmation.
Buy Example
- Open GBPJPY on an M15 or H1 chart.
- Identify a sequence of higher swing highs and higher swing lows.
- Wait for a blue upward arrow to mark a new swing low.
- Check whether the swing low forms near support or another bullish price-action area.
- Wait for a bullish candle or other confirmation that buyers are returning.
- Enter the buy after confirmation.
- Place the stop loss below the recent swing low.
- Target the previous swing high or the next resistance level.
Sell Example
- Open GBPJPY on an M15 or H1 chart.
- Look for a sequence of lower swing highs and lower swing lows.
- Wait for a red downward arrow to identify a new swing high.
- Check whether the swing high develops near resistance or another bearish price-action area.
- Wait for a bearish candle or confirmation of renewed selling pressure.
- Enter the sell after confirmation.
- Place the stop loss above the recent swing high.
- Use the previous swing low or next support level as a potential target.
This approach keeps the trade aligned with the prevailing market flow and reduces the temptation to react to minor price fluctuations.
The arrows are most useful as a way of organizing market structure rather than as standalone buy and sell commands.
Get Instant Free Access
Indicator Settings
- ExtDepth: Determines the number of bars considered when identifying swing highs and swing lows.
- ExtDeviation: Defines the required percentage price movement before the detected trend direction can change.
- ExtBackstep: Sets the minimum number of bars between identified swing highs and swing lows.
Important Notes
- Do not treat every arrow as an automatic trading signal.
- Use the sequence of swing points to establish the broader market direction.
- Higher highs and higher lows generally support a bullish market structure.
- Lower highs and lower lows generally indicate bearish market structure.
- Confirm reversal areas with support, resistance, candlestick patterns, or another technical method.
- Use recent swing points when planning stop-loss locations.
- Allow sufficient confirmation before entering, particularly on lower timeframes.









