
The Auto Trend Channel indicator for MT4 automatically draws price channels to help analyze both short-term and longer-term market movement.
By plotting upper and lower channel boundaries, it provides a practical framework for studying trend direction, pullbacks, breakouts, and potential reaction areas.
The channel boundaries can also function as dynamic price levels.
This makes them useful for planning entries, stop-loss positions, take-profit areas, and pending orders around clearly defined market zones.
Automatic channel construction also saves time compared with manually identifying swing points and adjusting trend lines as price develops.
Why traders use the Auto Trend Channel Indicator
Price rarely travels in a perfectly straight line.
During directional markets, it often moves between rising or falling boundaries before eventually breaking through one side.
Having these boundaries plotted automatically makes it easier to judge whether price is continuing inside the existing range or attempting to establish a new direction.
One of the main applications is breakout analysis.
A confirmed move beyond the channel can signal increasing momentum, while a move that quickly returns inside the channel can warn of a false breakout.
The channel can therefore be used alongside candlestick confirmation, support and resistance, or another trend method.
Always trade in the direction of the main trend whenever possible, particularly when using the channel for continuation setups.
Download This MT4 Indicator for Free
Indicator Chart Setup
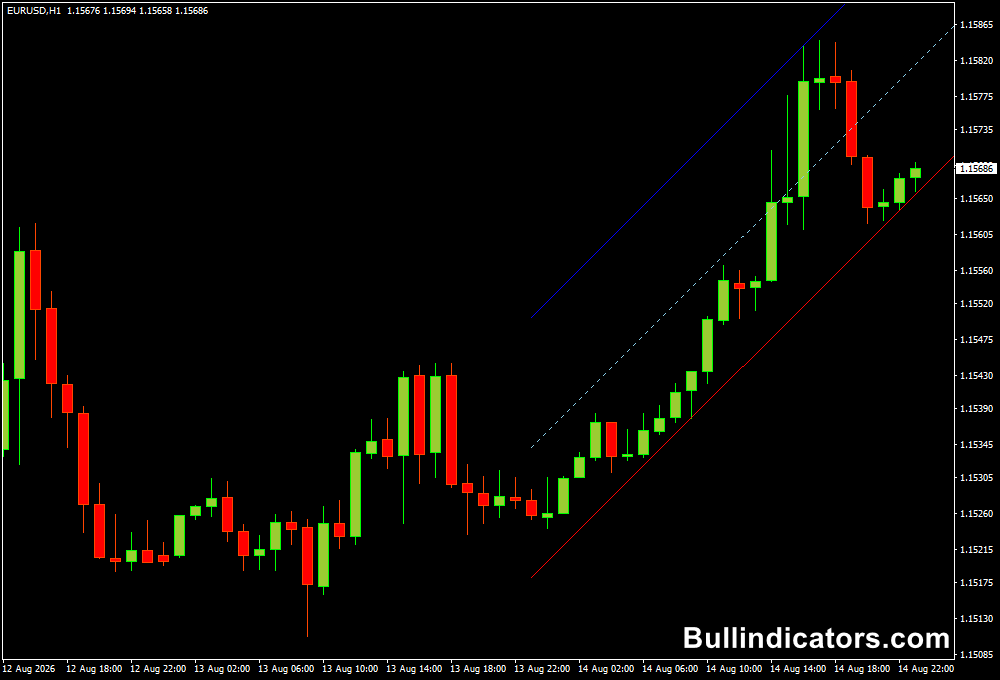
The tool adds an automatically calculated upper and lower trend boundary to the price chart.
These lines form a channel around the current market movement and can be used as dynamic support and resistance.
The line appearance can be customized, including colors and line styles.
This allows the channel to fit different chart layouts and makes the boundaries easier to distinguish during active trading sessions.
Core Features
- Automatically plots dynamic price channels.
- Helps identify the direction of the current trend.
- Provides upper and lower channel boundaries.
- Supports breakout and retest analysis.
- Can be used as a reference for pending orders and trade management.
- Offers customizable visual settings.
Best for
- Analyzing trending price movement.
- Finding potential channel breakouts.
- Planning entries around channel boundaries.
- Identifying dynamic support and resistance.
- Structuring stop-loss and profit-target levels.
Best Markets
- EURUSD for identifying orderly intraday channels during London and New York.
- GBPJPY for wider price swings and stronger breakout movements.
- USDJPY when directional moves create clearly defined H1 and H4 channels.
- GBPUSD around major session transitions and momentum expansions.
- XAUUSD for monitoring wider channels during active volatility periods.
Trading Styles
- Scalping on M5 and M15 when short-term channels are well defined.
- Intraday breakout trading on M15, M30, and H1.
- Trend-following strategies using channel pullbacks.
- Swing trading with H4 and D1 channels.
- Breakout-retest strategies around established channel boundaries.
How traders use it
A practical strategy is to monitor how price reacts around the upper and lower boundaries.
During an established bullish channel, traders can watch for pullbacks toward the lower boundary.
During a bearish channel, the upper boundary can become an area of interest for potential short setups.
Buy Setup
- Identify a bullish trend with a clearly defined rising channel.
- Wait for price to approach the upper channel boundary and break above it decisively.
- Look for a bullish candle to close beyond the channel rather than entering during a temporary spike.
- Wait for price to hold above the previous resistance area or retest it as support.
- Enter a buy after the breakout has been confirmed.
- Place the stop loss below the breakout area or relevant channel structure.
- Target the next resistance level or use a predefined risk-to-reward objective.
Sell Setup
- Identify a bearish trend with a clearly defined declining channel.
- Wait for price to break below the lower channel boundary.
- Look for a bearish candle to close below the channel.
- Check whether the broken support level becomes resistance during a retest.
- Enter a sell after the bearish breakout is confirmed.
- Place the stop loss above the breakout area or relevant channel structure.
- Target the next support level or a predefined risk-to-reward objective.
False Breakout Confirmation
A move outside the channel does not always lead to a new trend. If the following candles quickly return inside the channel, the breakout may have failed.
Waiting for follow-through or a successful retest can help distinguish a genuine expansion from a temporary price spike.
For example, if EURUSD breaks above a rising channel but the next candles close back inside the channel, entering immediately can expose the position to a reversal.
A stronger bullish setup would develop when price remains above the broken boundary and successfully uses that area as support.
Get Instant Free Access
Indicator Settings
- BarsForFract: Determines the bar parameter used by the channel calculation. The default value is 0, and changes to this setting may have little visible effect depending on the chart.
- Colors: Controls the colors used for the channel lines.
- Line Style: Determines how the channel boundaries are displayed on the chart.
Important Notes
- Always trade in the direction of the main trend whenever possible.
- A channel breakout should be confirmed by candle closes and follow-through.
- Price can temporarily move outside a channel before returning to its previous range.
- Channel boundaries can act as dynamic support and resistance but are not guaranteed reversal points.
- Combine breakout signals with price action, market structure, or another trend method.
- Higher-timeframe channels can provide broader market context, while lower timeframes offer more frequent setups.
- Test the strategy on historical data and a demo account before applying it with real capital.









