
The Auto Trend Channels indicator for MT4 automatically maps dynamic price channels across the market, helping you recognize the direction and boundaries of an existing trend.
Bullish channels are displayed with green trend lines, while bearish channels use red lines to distinguish the prevailing market bias.
Trend channels can provide useful reference points for both entries and trade management.
A trending market may repeatedly react around the upper and lower boundaries, creating potential pullback opportunities.
A decisive break beyond the channel can also signal that the existing movement is losing momentum or that a new phase may be developing.
Why traders use the Auto Trend Channels Indicator
Drawing accurate channels manually requires identifying suitable swing points and continuously adjusting the lines as price develops.
This tool automates that process and keeps the channel boundaries updated as market conditions change.
Trend-following traders can monitor reactions near the channel boundaries for continuation setups, while counter-trend traders can watch for confirmed breaks through the established channel.
The combination of channel position, candlestick behavior, and overall market direction can provide a more disciplined approach to evaluating entries.
Download This MT4 Indicator for Free
Indicator Chart Setup
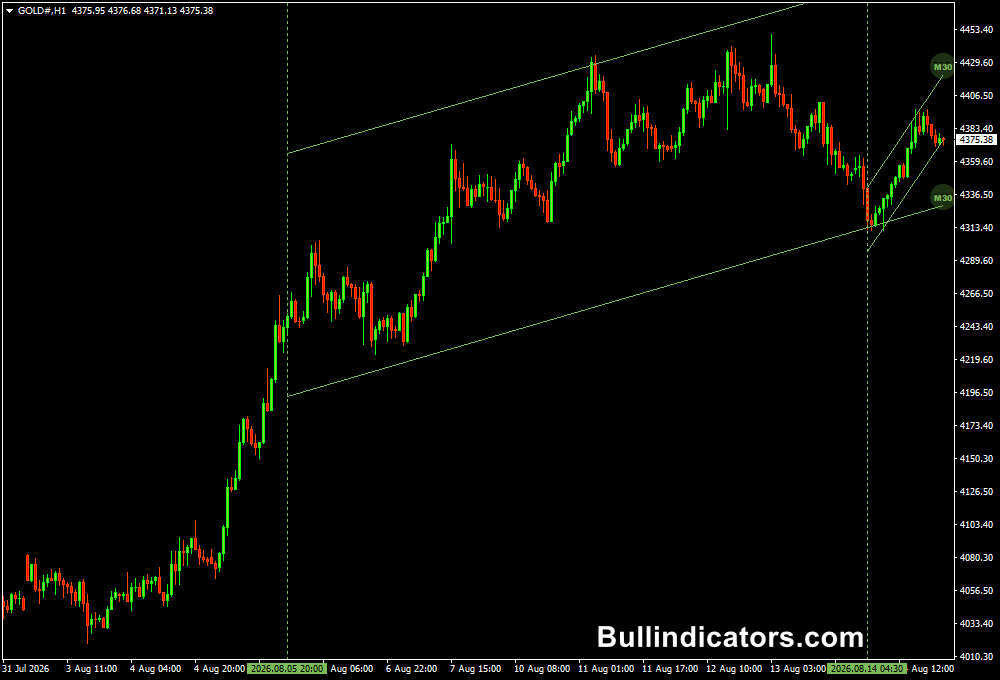
The chart displays two dynamic boundaries that form a channel around the current price movement.
Green lines identify bullish channel conditions, while red lines represent bearish conditions.
The channel provides a reference for assessing whether price is moving toward support, resistance, or approaching a potential breakout point.
For example, during an established bullish move, price may retreat toward the lower channel boundary before producing a bullish rejection candle.
A trader can then look for additional confirmation before considering a long position.
Core Features
- Automatically identifies dynamic trend channels.
- Recognizes bullish and bearish market conditions.
- Uses different colors to distinguish channel direction.
- Works across multiple MT4 timeframes.
- Useful for pullback and breakout analysis.
- Reduces the need to draw channels manually.
Best for
- Identifying the direction of an established trend.
- Finding potential entries around channel boundaries.
- Monitoring breakouts from established price channels.
- Supporting multi-timeframe technical analysis.
Best Markets
- EURUSD and GBPUSD for clean directional movements during major sessions.
- USDJPY and EURJPY when well-defined intraday channels develop.
- XAUUSD for traders looking to monitor wider channels during active sessions.
- Major forex pairs where sufficient liquidity helps produce recognizable price swings.
Trading Styles
- Scalping on M5 and M15 when short-term channels are clearly established.
- Day trading with M15 and H1 channel reactions.
- Swing trading using H4 and D1 trend boundaries.
- Breakout trading around decisive channel violations.
- Trend-following strategies focused on pullbacks toward channel support or resistance.
How traders use it
The first step is to establish the broader market direction.
A bullish channel suggests looking primarily for long opportunities, while a bearish channel favors short setups.
Always trade in the direction of the main trend when possible, particularly when using channel touches as continuation entries.
Suppose EURUSD is moving inside a bullish H4 channel and price retraces toward the lower boundary.
A rejection wick followed by a bullish candlestick can provide evidence that buyers are defending the area.
This can be used as confirmation for a potential long position, with risk managed according to the recent swing structure.
Another approach is to monitor a confirmed channel breakout.
If price closes decisively outside the established boundary, traders can assess whether momentum is strong enough to support a continuation move or whether the breakout represents a potential change in market direction.
Waiting for a candle close can help reduce reactions to temporary intrabar spikes.
Get Instant Free Access
Indicator Settings
- Channel Formation Algorithm: Determines how the price swings and channel boundaries are calculated.
- Display of the Channels: Controls whether borders or specific channel elements are displayed on the chart.
- Color Scheme: Controls the colors used for the bullish and bearish channel lines.
Important Notes
- Always prioritize the main market trend when evaluating channel reactions.
- A touch of a channel boundary does not guarantee an immediate reversal.
- Look for candlestick confirmation or additional price-action evidence before entering.
- Breakouts should preferably be confirmed by a candle close rather than a temporary price spike.
- Higher timeframes can provide stronger channel references, while lower timeframes generate more frequent setups.
- Use suitable stop-loss placement beyond relevant swing points or channel boundaries.









