
The Fractals Arrows indicator for MT4 provides a simple way to recognize potential changes in market direction using arrow-based fractal signals.
It is based on the well-known Bill Williams Fractal concept, which focuses on local highs and lows that can indicate shifts in price movement.
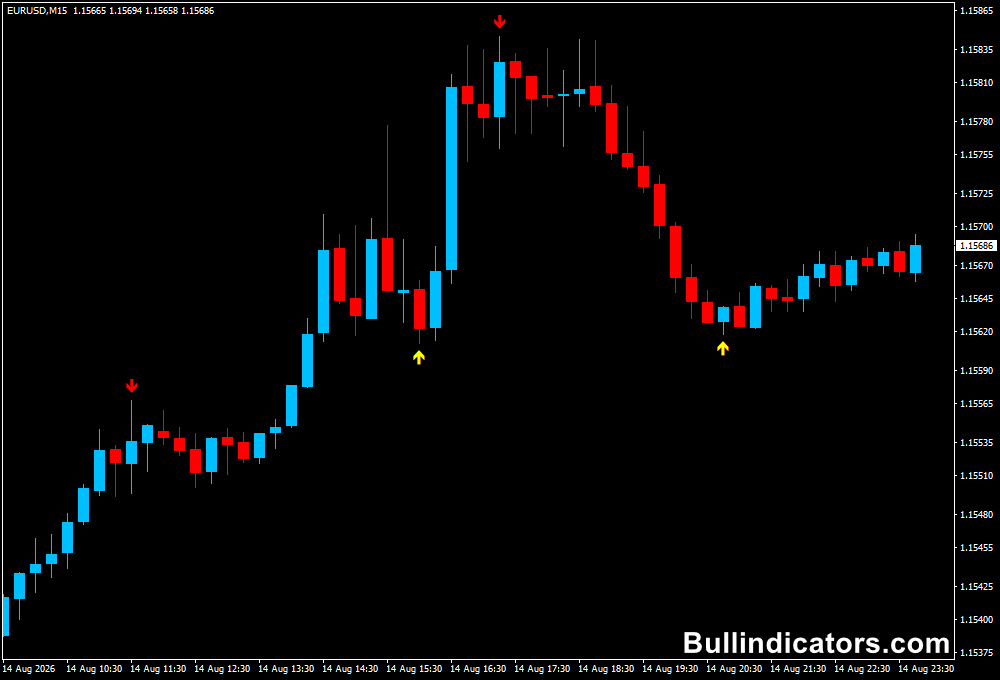
Yellow arrows identify potential bullish conditions, while red arrows indicate bearish pressure.
The visual presentation makes the tool easy to follow, particularly for traders who prefer a straightforward chart setup.
It can be used on different timeframes, although larger timeframes are generally more useful when you want to filter out some of the short-term market noise.
Why traders use the Fractals Arrows Indicator
Fractals can help highlight turning points that are otherwise difficult to identify when price is moving quickly.
By marking these areas with arrows, the tool provides a simple reference for determining where a swing may have formed and where a possible change in momentum is developing.
The signals become more useful when combined with the broader trend.
A bullish arrow during an established uptrend can be considered as a potential continuation opportunity, while a bearish arrow within a downtrend may offer an area to evaluate short positions.
Support, resistance, and candlestick confirmation can further improve the setup.
Download This MT4 Indicator for Free
Indicator Chart Setup
The indicator places fractal-based arrows directly on the price chart.
Yellow arrows point upward and represent potential bullish signals, while red arrows point downward and represent potential bearish signals.
The displayed signals can help organize the recent market structure, particularly when several fractal points form a recognizable sequence of higher highs, higher lows, lower highs, or lower lows.
Core Features
- Uses fractal-based market turning points.
- Displays bullish and bearish arrows directly on the chart.
- Provides visual trend-direction references.
- Supports adjustable fractal sensitivity.
- Allows the number of analyzed bars to be controlled.
- Includes optional alerts for new arrow signals.
Best for
- Identifying potential swing points.
- Following short-term changes in market direction.
- Confirming pullbacks within established trends.
- Locating areas for additional price-action analysis.
- Building simple trend-following strategies.
Best Markets
- EURUSD for structured intraday movements.
- GBPUSD during active London and New York sessions.
- GBPJPY for larger swing movements and stronger momentum.
- USDJPY when analyzing directional moves across Asian and European sessions.
- XAUUSD for traders who want to monitor significant short-term turning points.
Trading Styles
- Scalping on M5 and M15 with additional trend confirmation.
- Day trading using M15 and H1 signals.
- Trend-following strategies on H1 and H4.
- Pullback trading around recently confirmed fractal points.
- Swing analysis on H4 and D1 charts.
How traders use it
The simplest method is to use the arrows as potential directional signals and then confirm them with the overall trend.
Always trade in the direction of the main trend when possible.
This is especially important on lower timeframes, where temporary price fluctuations can create more frequent signals.
Buy Setup
- Identify a bullish market using price structure or a separate trend method.
- Wait for a yellow upward fractal arrow to appear.
- Check whether the signal develops near support or after a bullish pullback.
- Look for a bullish candlestick confirmation.
- Enter a buy after the confirmation candle closes.
- Place the stop loss below the relevant swing low.
- Target the previous swing high, resistance, or another predefined profit level.
Sell Setup
- Confirm that the broader market is bearish.
- Wait for a red downward fractal arrow.
- Check whether the signal forms near resistance or following a bearish retracement.
- Look for bearish price-action confirmation.
- Enter a sell once the confirmation candle closes.
- Place the stop loss above the relevant swing high.
- Target the previous swing low, support, or another suitable profit objective.
Example on GBPUSD
- Open GBPUSD on an H1 chart and establish the main market direction.
- Suppose price is forming higher highs and higher lows.
- Wait for a retracement toward a previous support area.
- A yellow fractal arrow appears near the support zone.
- A bullish candle then closes after rejecting the level.
- Consider a long entry after the confirmation.
- Place the stop below the recent swing low.
- Use the previous high or a nearby resistance level as the initial target.
This approach is generally more reliable than entering immediately whenever an arrow appears.
The fractal signal identifies an area of interest, while market structure and price action provide the additional context needed to evaluate the trade.
Get Instant Free Access
Indicator Settings
- FrPeriod: Sets the fractal calculation period. The default value is 6 and controls the sensitivity of the detected fractal points.
- MaxBars: Determines how many historical bars the indicator analyzes and displays. The default value is 500.
- Alertss: Enables or disables alerts whenever a new arrow signal appears.
Important Notes
- Always use the main market trend as the primary directional filter.
- A fractal arrow should be treated as a potential setup rather than a guaranteed entry.
- Higher timeframes can help reduce the number of weaker signals produced by short-term market noise.
- Combine fractal signals with support, resistance, price action, or another trend method for additional confirmation.
- Wait for the relevant price structure or candle confirmation before entering.
- Use recent swing points to define logical stop-loss locations.
- Apply consistent risk management to every position.









