
The Jebatfx Breakout Trendline indicator for MT4 automatically identifies relevant trendlines and projects potential breakout targets directly onto the chart.
It is designed for traders who use trendline breaks to identify changes in market direction and potential momentum moves.
The tool can be particularly useful during active trading sessions when price approaches an established trendline.
Once the market breaks through the line, the projected target provides a reference for managing the position.
This makes the indicator suitable for both short-term scalping and higher-timeframe breakout trading.
Why traders use the Jebatfx Breakout Trendline Indicator
Trendlines can provide important information about whether buyers or sellers are maintaining control.
A sequence of reactions around the same descending or ascending line can create a well-defined breakout level.
The Jebatfx indicator automatically draws these trendlines and adds projection lines that can help estimate a potential profit area.
This can make breakout analysis faster, particularly when several currency pairs are being monitored.
The strongest setups generally occur when price has respected the trendline multiple times before breaking through it.
A breakout following three or more meaningful reactions can carry more significance than a line that has only been touched once.
Download This MT4 Indicator for Free
Indicator Chart Setup
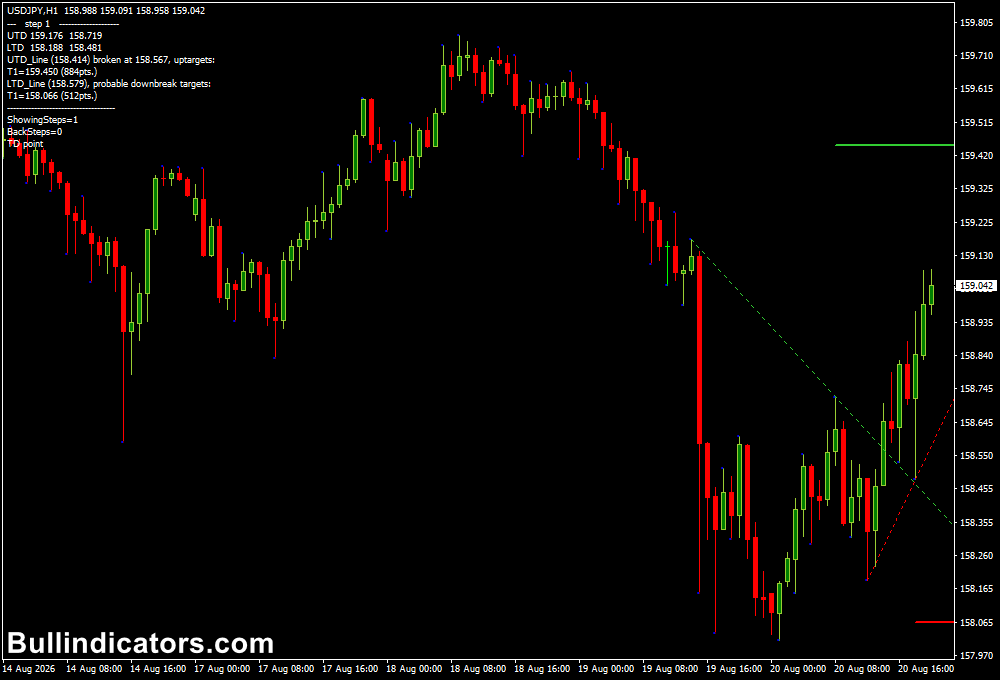
The indicator displays trendlines directly across the price chart together with projection lines that extend beyond the breakout area.
These projections can be used as potential take-profit references after price moves through the trendline.
A bearish setup generally develops when price breaks below an ascending trendline.
A bullish setup occurs when price moves above a descending trendline.
The breakout candle is important.
A temporary spike through the line can become a false breakout, so many short-term setups benefit from waiting for a candle close beyond the trendline before entering.
Core Features
- Automatically identifies and draws trendlines.
- Highlights potential bullish and bearish breakout areas.
- Projects potential take-profit zones beyond the breakout.
- Supports different projection line styles and widths.
- Allows upper and lower projection colors to be customized.
- Can be used across multiple MT4 timeframes.
Best for
- Trendline breakout trading.
- Short-term scalping during active market sessions.
- Intraday momentum trades.
- Higher-timeframe breakout confirmation.
- Identifying potential continuation moves after consolidation.
Best Markets
- EURUSD for lower-spread breakout scalping.
- GBPUSD during London session volatility.
- USDJPY for directional moves during London and New York overlap.
- GBPJPY for aggressive breakout strategies with larger intraday ranges.
- XAUUSD when gold is forming well-defined trendlines around major price levels.
Trading Styles
- M1 and M5 breakout scalping.
- M15 intraday momentum trading.
- H1 trendline breakout strategies.
- H4 swing-style breakout setups.
- London and New York session trading.
How traders use it for scalping
For scalping, the M1 or M5 chart can be used to locate a trendline that price has respected several times.
Once the line has at least three meaningful reactions, wait for a decisive candle close beyond it.
A simple approach is to use the direction of the breakout as the trade direction and the projection line as a potential target.
The stop loss can be placed on the opposite side of the most recent swing, keeping the distance appropriate for the current volatility.
Example Buy Setup
- Price forms a descending trendline with at least three reactions.
- The market approaches the trendline during an active trading session.
- A bullish M5 candle closes above the trendline.
- Enter a BUY position after breakout confirmation.
- Place the stop below the latest swing low or another logical support area.
- Use the projected upper target as a reference for taking profit.
Example Sell Setup
- Price develops an ascending trendline with several confirmed reactions.
- Sellers begin pushing price toward the trendline.
- A bearish M5 candle closes below the trendline.
- Enter a SELL position after the breakout is confirmed.
- Place the stop above the latest swing high or nearby resistance.
- Use the lower projection as a potential profit objective.
For faster M1 scalping, the same concept can be applied with a smaller target, provided the pair has sufficient volatility and spread conditions are favorable.
A higher-timeframe trend direction can also be used to filter M1 signals.
Get Instant Free Access
Indicator Settings
- Projection Lines – Enables or disables the projection lines displayed after the trendline setup.
- Projection Line Style – Selects the visual style of the projection lines.
- Projection Line Width – Controls the thickness of the projection lines.
- Upper Projection Line Color – Sets the color used for the upper projection.
- Lower Projection Line Color – Sets the color used for the lower projection.
- Colors – Customize the appearance of the chart elements where available.
- Line Style – Adjusts the appearance of the indicator’s drawn lines.
Important Notes
- Give greater weight to trendlines that have been respected at least three times.
- Wait for a candle close beyond the trendline when possible to reduce false breakout entries.
- False breakouts can occur frequently, particularly during quiet market conditions.
- For scalping, focus on liquid pairs with tight spreads and active sessions.
- The projected target is a reference and should be evaluated against current market conditions.
- Risk management remains essential even when the breakout appears strong.









