
The Previous High Low indicator for MT4 marks important price levels from the previous day, week, month, and year directly on the MetaTrader 4 chart.
These reference points can become significant areas of support and resistance, particularly when price approaches them during an active trading session.
Eight levels are displayed: Previous Day High and Low, Previous Week High and Low, Previous Month High and Low, plus Previous Year High and Low.
The indicator does not generate conventional BUY or SELL arrows.
Its purpose is to provide important price references that can be incorporated into an existing trading method.
For intraday and lower-timeframe trading, these levels are particularly useful because a trader can see where major highs and lows from larger periods are located without having to switch between multiple charts.
Why traders use the Previous High Low Indicator
Previous highs and lows can become important reaction points because they represent prices that the market has already reached during a completed trading period.
When price returns to one of these areas, buyers and sellers may react strongly.
The Previous High Low Indicator keeps these levels visible while trading on M1, M5, M15, or H1 charts.
This gives short-term setups additional context.
For example, a BUY signal from another technical tool may carry more weight when it develops near the previous day low and price shows signs of rejection.
The levels can also change roles.
A previous high that initially acts as resistance can become support after a decisive bullish breakout.
The same principle applies to previous lows that are broken and subsequently tested from underneath.
Download This MT4 Indicator for Free
Indicator Chart Setup
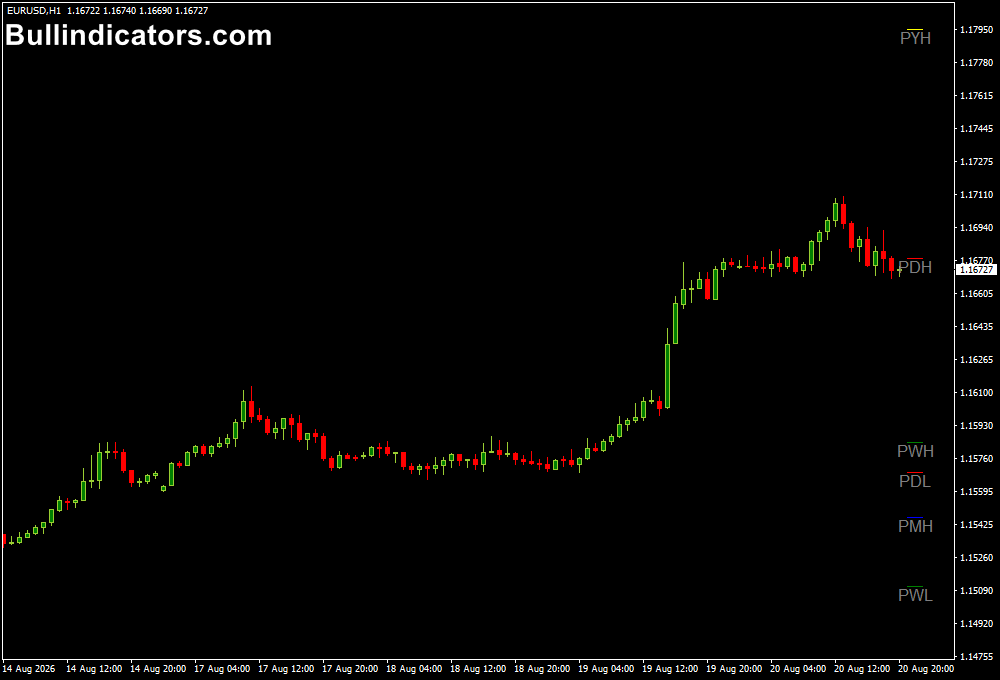
The indicator draws horizontal marks across the chart and labels them according to the period they represent.
PDH identifies the Previous Day High, while PDL marks the Previous Day Low.
PWH and PWL represent the previous week’s extremes, with PMH and PML showing monthly levels.
PYH and PYL identify the previous year’s high and low.
These lines remain useful throughout the trading session because they provide fixed reference points from completed periods.
The chart can therefore be monitored for rejection, breakout, retest, or consolidation around each level.
Core Features
- Displays eight major previous-period high and low levels.
- Includes daily, weekly, monthly, and yearly reference points.
- Designed for lower-timeframe and intraday analysis.
- Provides fixed support and resistance references.
- Allows colors and line thickness to be customized.
- Includes configurable alert options.
- Does not produce conventional directional arrows.
Best for
- Identifying intraday support and resistance.
- Trading reactions around previous session extremes.
- Breakout and retest strategies.
- Filtering signals generated by other technical tools.
- Setting realistic profit targets around important market levels.
Best Markets
- EURUSD and GBPUSD for liquid intraday setups.
- USDJPY around important Asian and London session levels.
- GBPJPY for larger reactions around weekly and monthly extremes.
- XAUUSD where previous daily and weekly levels can become important intraday reference points.
- Major indices such as US30 and NAS100 can also be monitored for reactions around previous-period extremes.
Trading Styles
- M5 scalping around previous-day levels.
- M15 intraday support and resistance trading.
- H1 breakout and retest setups.
- London session range strategies.
- New York session reversal and continuation trades.
- Swing trading using previous weekly and monthly extremes.
How traders use it
The indicator works particularly well as a location filter.
Instead of taking a technical signal wherever it appears, the previous-period levels can be used to determine whether price is approaching an area where a reaction is more likely.
For example, a trader working on M5 may notice that price is approaching PDL.
If price touches the previous day low and forms a bullish rejection candle, this can create a potential BUY setup.
A stop can be placed below the recent swing low, while the previous day’s midpoint, session high, or another marked level can provide a logical target.
A breakout approach is also possible. If price closes decisively above PDH, the old resistance can become a potential support zone.
A subsequent retest that holds above PDH may provide an opportunity to enter in the direction of the breakout.
Example BUY Setup
- Price approaches PDL on the M5 chart.
- The level has already produced a visible reaction.
- A bullish candle rejects the area and closes back above PDL.
- Consider a BUY entry after confirmation.
- Place the stop below the rejection swing.
- Target the next significant resistance or previous-period level.
Example SELL Setup
- Price reaches PDH during an active trading session.
- The market fails to break above the previous day’s high.
- A bearish candle closes back below the level.
- Consider a SELL entry following confirmation.
- Place the stop above the recent swing high.
- Use the next support level or previous-period low as a potential target.
For scalpers, the strongest opportunities often occur when a previous high or low aligns with another technical factor such as a trendline, moving average, momentum signal, or candlestick formation.
This creates a confluence-based approach rather than relying on the level alone.
Get Instant Free Access
Indicator Settings
- Previous-period display block – Enables or disables the high and low levels for the day, week, month, and year.
- Level Colors – Sets individual colors for the displayed high and low marks.
- Line Thickness – Controls the width of the horizontal levels on the chart.
- Text Parameters – Configures the appearance and positioning of the level labels.
- Alerts – Controls notification functions associated with price reaching the marked levels.
- Audible Alerts – Enables sound notifications when configured conditions occur.
- Popup Notifications – Displays alerts directly inside MetaTrader 4.
- Email and Other Notifications – Allows available notification methods to be configured according to the platform settings.
Important Notes
- The indicator identifies important reference levels but does not provide guaranteed BUY or SELL signals.
- A reaction at a previous high or low should preferably be confirmed with price action or another trading method.
- Previous-period levels can act as either support or resistance depending on how price interacts with them.
- Breakouts should be evaluated using candle closes and subsequent price behavior to reduce exposure to false moves.
- Weekly, monthly, and yearly levels can be more significant than nearby daily levels when several marks are clustered together.
- Use sensible position sizing and place the stop at a technically meaningful location.
- Test the strategy on a demo account before applying it to live trading.









