
The LuxAlgo Liquidity Sweeps indicator for MT5 is designed to highlight areas where price moves through important swing highs or lows before potentially changing direction.
By focusing on swing points and candle wicks, the indicator helps reveal liquidity sweeps that can be difficult to identify from price action alone.
It is particularly useful for traders who use liquidity concepts, market structure, and smart-money or ICT-inspired methods.
Why traders use the LuxAlgo Liquidity Sweeps Indicator
Markets frequently move beyond previous highs or lows before reversing.
These moves can trigger stop orders and breakout entries around obvious swing levels.
The Liquidity Sweeps Indicator marks these events visually, helping traders distinguish a potential liquidity grab from an ordinary price breakout.
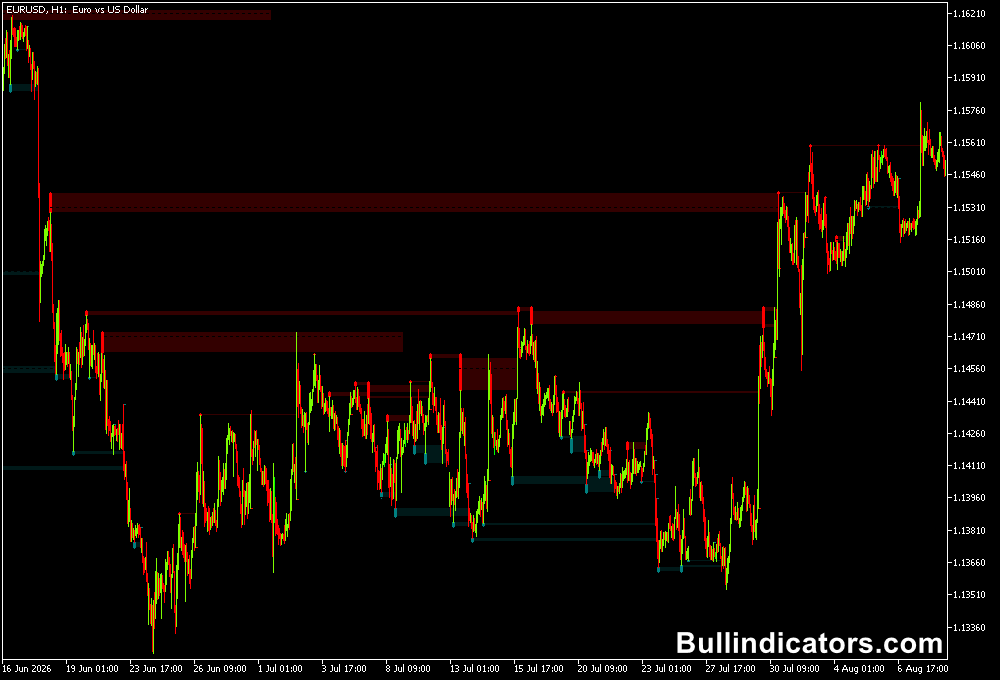
A teal marker below a swing low represents a bullish liquidity sweep, while a red marker above a swing high represents a bearish sweep.
The indicator can also extend the sweep area forward, allowing the original wick zone to remain visible as a potential future support or resistance area.
This creates two useful pieces of information: where liquidity was swept and where price may react if it returns to the same area.
Multiple overlapping sweep zones can be particularly interesting because they indicate that several liquidity events have occurred around a similar price level.
Download This MT5 Indicator for Free
Indicator Chart Setup
The indicator analyzes swing highs and swing lows and looks for price movements that penetrate these areas.
When a significant low is swept, a bullish marker is displayed below the swing. When a significant high is taken, a bearish marker appears above the swing.
Horizontal shaded areas can also be projected from the sweep wick into the future.
These areas give the chart a visual reference for previous liquidity activity.
If price returns to one of these zones, it can be monitored for rejection, continuation, or another liquidity event.
Core Features
- Swing-based detection of potential liquidity sweeps.
- Bullish markers below swept swing lows.
- Bearish markers above swept swing highs.
- Optional wick-only detection for more specific sweep identification.
- Horizontal sweep zones that can extend into future candles.
- Visual identification of overlapping liquidity areas.
- Adjustable bullish and bearish marker colors.
Best for
- Finding potential reversal areas after a previous high or low is taken.
- Identifying false-breakout and stop-hunt type price movements.
- Combining liquidity sweeps with market structure and price action.
- Locating areas where price may react when returning to an earlier sweep zone.
- Building entry and exit plans around concentrated liquidity.
Best Markets
- Gold (XAUUSD), where sharp intraday moves frequently test previous highs and lows.
- EURUSD for cleaner liquidity structures during London and US sessions.
- GBPUSD when volatility creates frequent breaks of intraday swing points.
- US indices during active sessions where strong liquidity runs can develop.
- Major Forex pairs with sufficient volume and intraday movement.
Trading Styles
- M5 scalping around recent swing highs and lows.
- M15 intraday reversal trading after a confirmed liquidity sweep.
- London-session liquidity analysis on EURUSD and GBPUSD.
- US-session Gold scalping when previous session highs or lows are attacked.
- Smart-money and ICT-inspired strategies using liquidity as an additional market-structure reference.
How traders use it
The key is not to treat every sweep marker as an automatic entry signal.
A sweep tells you that price has taken liquidity around a swing point.
The next question is what price does after the sweep.
A strong rejection back inside the previous range can support a reversal setup, while a sustained break and continuation can indicate that the sweep was followed by genuine directional expansion.
For example, consider Gold on an M5 chart during the London or US session.
XAUUSD may trade below a visible intraday low, trigger stops underneath that low, and then quickly recover above it.
If the indicator prints a bullish sweep marker and the next candles show rejection and renewed buying pressure, the event can become a potential long setup.
Gold M5 Buy Example
- Identify a clear recent swing low on the XAUUSD M5 chart.
- Wait for Gold to push below that low rather than buying before the liquidity is taken.
- A teal bullish sweep marker appearing below the swing low indicates that the area has been swept.
- Look for price to close back above the previous low, showing that the downside break has been rejected.
- For additional confirmation, wait for a short-term bullish structure break or a strong bullish M5 candle.
- A possible entry can be considered after the reclaim of the swept level or on a controlled retest of the sweep zone.
- Place the protective stop below the sweep extreme, allowing enough room for normal Gold volatility.
- Potential targets can be the previous intraday high, a nearby liquidity zone, or the next significant resistance area.
- If price quickly returns below the swept low and remains there, the bullish setup should be reconsidered.
Gold M5 Sell Example
- Locate a visible swing high that has attracted several recent price tests.
- Wait for Gold to trade above that high and take the liquidity resting above it.
- A red bearish sweep marker above the swing high signals a potential buy-side liquidity sweep.
- Look for rejection back below the previous high instead of entering solely because the marker appeared.
- A bearish M5 structure break after the sweep provides stronger confirmation of a possible short setup.
- Consider an entry after price moves back below the swept high or retests the sweep area from underneath.
- Place the stop above the sweep extreme, accounting for Gold’s tendency to produce sharp wicks.
- Possible downside objectives include the previous intraday low, an opposing liquidity zone, or another significant support area.
- If price accepts above the swept high and continues higher, the bearish reversal idea is invalidated.
Get Instant Free Access
Indicator Settings
- Swings: Sets the lookback used to detect swing highs and swing lows. Lower values produce more frequent swing signals, while higher values focus on more significant structures.
- Options: Select “Only Wicks” to concentrate detection on candle tails rather than requiring the full candle body to break the swing level.
- Bull / Bear Colors: Controls the colors used for bullish and bearish sweep markers.
- Sweep Area – Extend: Enables horizontal sweep areas to be projected forward from the original wick zone.
- Max Bars to Extend: Determines how many future candles the sweep area remains visible.
- Bull 3 / Bear 3 Colors: Sets the fill colors used for third-tier sweep zones when several liquidity areas overlap.
Important Notes
- A liquidity sweep identifies an important price event, not a guaranteed reversal.
- Confirmation from price structure, candle rejection, momentum, or another technical method can improve trade selection.
- Wick-only mode can be useful when the goal is to focus specifically on stop-taking moves beyond swing levels.
- Overlapping sweep zones deserve attention because repeated liquidity activity around one area can create an important reaction zone.
- Gold requires careful risk management because M5 candles can expand rapidly during major market sessions and economic releases.
- Use the sweep zone as a reference for planning the trade rather than assuming price must reverse from it.









