
The Fractal Levels indicator for MT5 turns traditional Bill Williams fractals into clearly defined support and resistance levels.
Rather than displaying isolated fractal markers alone, it connects the relevant bullish and bearish fractals to create horizontal reference levels that can be monitored as price develops.
This makes the tool particularly useful in trending markets.
When price is moving strongly in one direction, previous fractal levels can provide a clear framework for identifying consolidation breaks, continuation entries, and areas where the current trend may encounter resistance or support.
Why traders use the Fractal Levels Indicator
Fractals identify local price extremes. A bullish fractal forms around a local low, while a bearish fractal forms around a local high.
The Fractal Levels Indicator takes these turning points and makes them easier to use as trading levels.
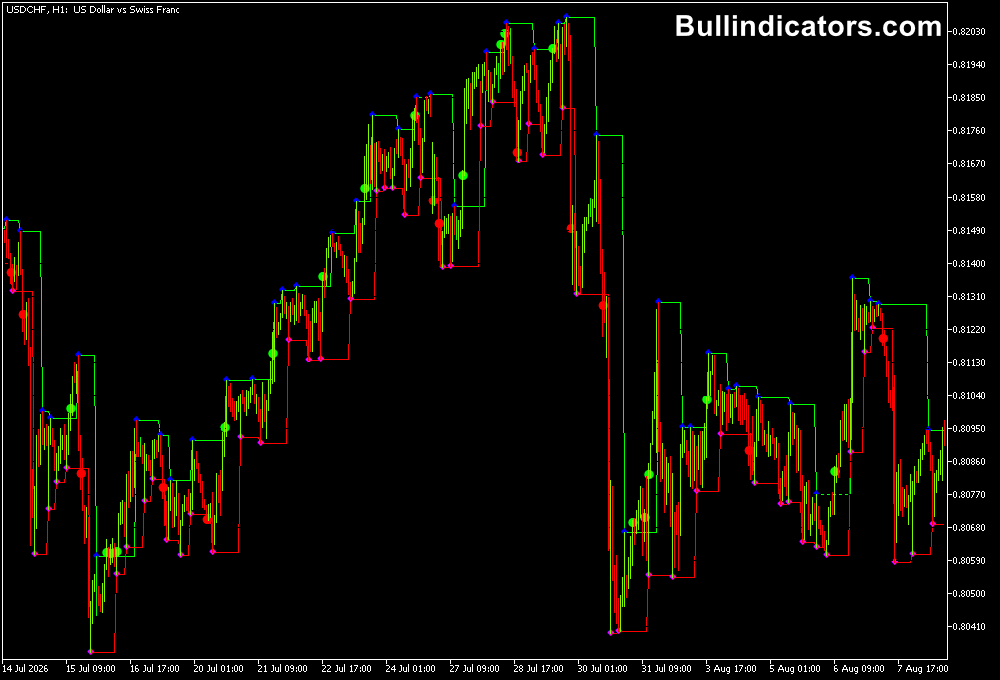
The blue line connects bearish fractals and acts as resistance, while the red line connects bullish fractals and acts as support.
This is particularly useful when several fractals develop around similar prices, creating a level that the market has repeatedly respected.
One important characteristic is the two-bar confirmation delay.
A fractal requires two completed bars on its right side, so the level should be treated as confirmed historical structure rather than a prediction of where the next turning point will occur.
Download This MT5 Indicator for Free
Indicator Chart Setup
The indicator is displayed directly on the MT5 price chart.
Blue levels identify resistance created from bearish fractals, while red levels represent support derived from bullish fractals.
These levels allow price to be assessed in relation to previous market extremes.
The result is a simple structure map.
When price approaches a resistance level during an established uptrend, a breakout can signal continuation.
In a strong downtrend, a break below a support level can provide a similar continuation setup.
Core Features
- Automatically identifies bullish and bearish fractals.
- Plots fractal-based support and resistance levels.
- Blue resistance levels connect bearish fractals.
- Red support levels connect bullish fractals.
- Useful for breakout and breakdown analysis.
- Can be applied to both short-term and longer-term charts.
- Simple settings allow the fractal sensitivity to be adjusted.
Best for
- Identifying established support and resistance from market structure.
- Trading continuation breakouts in strong directional markets.
- Locating areas where price has repeatedly reacted.
- Combining fractal levels with moving averages, momentum tools, or trend indicators.
- Planning entries, protective stops, and potential breakout targets.
Best Markets
- EURUSD when London or US-session momentum creates clean directional breaks.
- GBPJPY for volatile breakout conditions during active market hours.
- Gold when strong momentum pushes price through established intraday levels.
- Major stock indices during sustained directional sessions.
- Liquid Forex pairs where fractal levels can develop around clearly defined swing points.
Trading Styles
- M15 breakout trading during London and New York sessions.
- H1 trend continuation using established fractal resistance and support.
- M5 scalping when a strong intraday trend produces repeated breakout structures.
- Swing trading on H4 and Daily charts around major fractal levels.
How traders use it
One of the strongest applications is breakout trading during a well-established trend.
The key is to avoid treating every fractal level as a trade signal.
In a strong bullish market, for example, repeated resistance levels can form as price pauses before another expansion.
A close above one of these levels can show that buyers have pushed through the previous swing high.
A useful approach is to wait for the breakout candle to close, then assess whether price can hold above the former resistance.
This helps distinguish a genuine continuation from a temporary spike above the level.
Real Example: EURUSD M15 Bullish Breakout
- EURUSD is trading above a rising moving average and producing higher highs and higher lows on the M15 chart.
- A bearish fractal forms near 1.1080, creating a blue resistance level.
- Price consolidates below 1.1080 while the broader trend remains bullish.
- During the London session, an M15 candle closes clearly above 1.1080, confirming a breakout of the fractal resistance.
- Rather than chasing the initial candle, wait for price to pull back toward the broken 1.1080 level.
- If the former resistance holds as support and bullish price action appears, the retest can provide a more controlled long entry.
- A protective stop can be positioned below the retest structure or below the relevant breakout swing.
- The next fractal resistance level can provide an initial profit objective.
- Another approach is to target at least 1.5 times the amount risked and manage the position as the trend develops.
- If EURUSD falls back below the breakout level and fails to recover, the continuation setup loses strength and should be reassessed.
The same principle works in a strong bearish market. If price repeatedly respects a red fractal support level and then closes below it, the breakdown can provide a continuation opportunity. A retest of the broken support from underneath can then act as confirmation for a short position.
Get Instant Free Access
Indicator Settings
- Bars Left: Sets how many bars to the left are considered when identifying a fractal.
- Bars Right: Sets how many bars to the right are required for fractal confirmation.
- Lower values produce more fractals and therefore more frequent levels.
- Higher values filter out smaller price swings and focus on more significant market extremes.
Important Notes
- Fractals are confirmed with a delay because the required bars on the right must be completed.
- A fractal level is a reference point, not a guaranteed support or resistance barrier.
- Breakouts are generally more meaningful when they agree with the prevailing market trend.
- In strong trends, previous resistance can become support after an upside breakout, while previous support can become resistance following a breakdown.
- False breakouts can occur, so waiting for a candle close and, where appropriate, a retest can improve trade selection.
- Risk management remains essential because even well-established fractal levels can fail during periods of high volatility.









