
The MACD RSI indicator for MT5 combines MACD momentum analysis with RSI overbought and oversold conditions in one trading tool.
The indicator uses moving averages to assess momentum while the RSI component helps identify when price has reached an extended condition.
This combination can be useful for timing entries, especially when momentum and the broader market direction point the same way.
Although the MACD RSI can be used on its own, it becomes more useful when paired with a genuine trend filter.
A practical combination is the Super Trend MTF with Alerts Indicator for MT5.
Its green line represents the main bullish direction, while the red line indicates the main bearish direction.
This allows the MACD RSI to focus on entry timing while the Super Trend MTF establishes the directional bias.
Why traders use the MACD RSI Indicator
MACD and RSI measure different aspects of momentum.
MACD focuses on the relationship between moving averages and the resulting momentum, while RSI measures the speed and strength of recent price movement.
Combining them provides more context than relying on either reading alone.
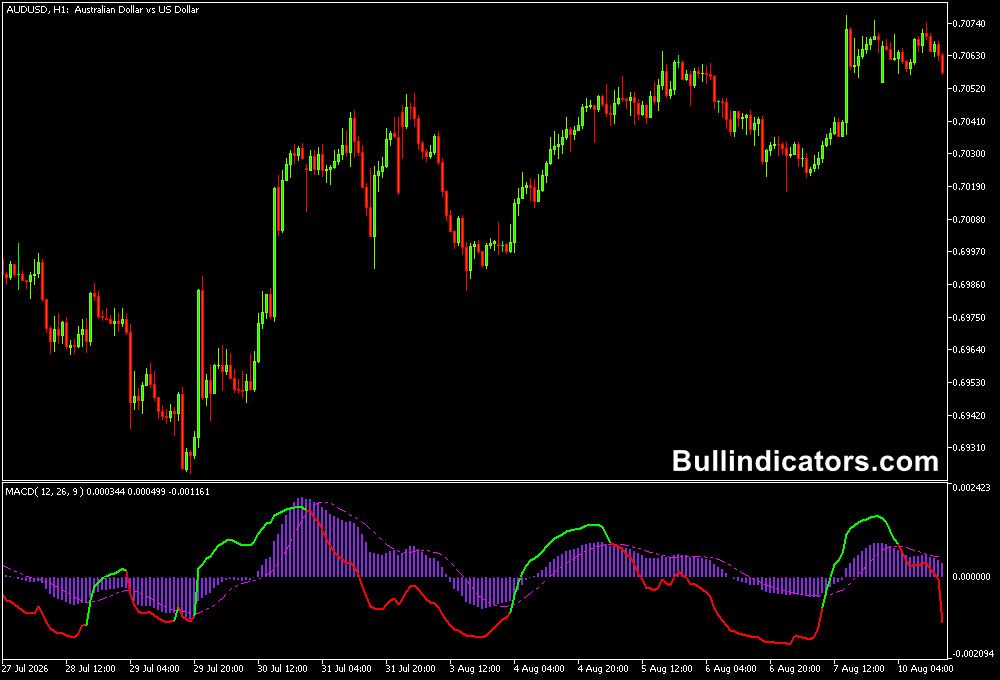
The MACD RSI displays three moving-average components together with an RSI-based reading.
The magenta line represents the Signal SMA, while the green-red line represents the slower RSI component.
RSI readings around 70 or higher indicate overbought conditions, while readings around 30 or lower indicate oversold conditions.
The strongest setups occur when an extreme momentum reading agrees with the prevailing trend.
For example, an oversold condition during a confirmed bullish trend can provide an opportunity to look for a pullback entry rather than selling into the main trend.
Download This MT5 Indicator for Free
Indicator Chart Setup
The MACD RSI is displayed in a separate indicator window below the price chart.
The MACD component uses a fast EMA, slow EMA, and signal SMA to show momentum changes.
The RSI component adds an overbought and oversold perspective to the same analysis.
Because short-term momentum can change rapidly, the indicator can produce conflicting signals during sideways markets.
A higher-timeframe trend filter can therefore be valuable when using it for scalping.
Core Features
- Combines MACD and RSI momentum analysis.
- Uses fast and slow exponential moving averages.
- Includes a signal SMA for momentum comparison.
- RSI identifies overbought and oversold conditions.
- Can be used across multiple timeframes.
- Useful for pullback and momentum-entry strategies.
Best for
- Timing entries after momentum pullbacks.
- Identifying overbought and oversold market conditions.
- Confirming momentum in the direction of a larger trend.
- Short-term scalping when combined with a higher-timeframe trend filter.
- Intraday setups where momentum and trend direction can be evaluated separately.
Best Markets
- GBPUSD for fast intraday momentum and short-term scalping.
- EURUSD for generally liquid M1 to H1 setups.
- GBPJPY when volatility provides sufficient momentum for short-term trades.
- EURJPY during active European and US trading sessions.
- Gold when momentum conditions are clear and risk is adjusted for its volatility.
Trading Styles
- M1 scalping with M15 trend confirmation.
- M5 momentum trading using the higher-timeframe direction as a filter.
- M15 intraday pullback trading.
- H1 trend continuation setups using RSI extremes for entry timing.
- Momentum-based Forex strategies during London and New York sessions.
How traders use it
A useful method is to separate trend identification from entry timing.
The Super Trend MTF can determine whether the main market direction is bullish or bearish, while MACD RSI waits for a temporary momentum extreme before looking for an entry.
For example, a green Super Trend line on the M15 chart establishes a bullish environment.
On the M1 scalper chart, an oversold MACD RSI reading can then be treated as a potential pullback opportunity.
The objective is not to buy simply because RSI reaches 30, but to wait for momentum to begin turning back in the direction of the higher-timeframe trend.
GBPUSD M1 Scalping Case Study
- Start with GBPUSD on the M15 chart and check the Super Trend MTF before taking any M1 signals.
- The M15 Super Trend displays a green line, establishing a bullish main trend.
- Move to the M1 chart and wait for GBPUSD to experience a short-term pullback rather than chasing an extended bullish candle.
- The MACD RSI moves toward or below the 30 oversold area as the pullback develops.
- The M1 MACD component shows the short-term momentum losing bearish strength.
- Wait for price action to begin turning upward rather than entering solely because the RSI is oversold.
- A bullish momentum shift on M1, while M15 remains green, creates a stronger alignment between entry timing and trend direction.
- A possible long entry can be taken after the M1 reversal is confirmed by price action.
- The protective stop can be placed below the recent M1 swing low, with the distance adjusted to current GBPUSD volatility.
- A short-term target can be based on the previous M1 high, a nearby resistance level, or a predefined risk-to-reward ratio.
- If the M15 Super Trend changes from green to red, bullish M1 setups should be treated with much more caution.
The same process can be reversed for short trades.
A red M15 Super Trend establishes the bearish environment, then an overbought MACD RSI reading on M1 can provide the starting point for looking for a bearish momentum reversal.
MACD RSI Sell Example
- M15 Super Trend is red, confirming the main bearish direction.
- GBPUSD rallies temporarily on M1 against the larger trend.
- MACD RSI moves into the overbought region around 70 or higher.
- Price begins rejecting the short-term high and bearish momentum returns.
- A bearish M1 confirmation can be used to time the short entry.
- The stop can be positioned above the recent M1 swing high.
- The previous M1 low or another nearby support area can be used as a potential target.
Get Instant Free Access
Indicator Settings
- Period of MACD Fast Moving Average: Default value is 12 and controls the fast EMA period.
- Depth of MACD Slow Moving Average: Default value is 26 and controls the slower EMA period.
- Indicator Averaging Method: Determines the averaging method used in the calculation.
- SignalSMA: Default value is 9 and controls the signal SMA period.
- RSIperiod: Default value is 3 and determines the RSI calculation period.
Important Notes
- MACD RSI signals should be interpreted in the context of the prevailing market trend.
- Oversold conditions can remain oversold during a strong bearish market, while overbought readings can persist during strong bullish trends.
- Using the M15 Super Trend MTF as a directional filter can help reduce counter-trend M1 signals.
- For scalping, wait for price action and momentum to turn rather than entering immediately when an extreme RSI reading appears.
- Major economic releases can produce rapid GBPUSD movements that make M1 signals less reliable.
- Always use appropriate risk management because momentum indicators do not guarantee the direction of the next price movement.









