The Double Stochastic RSI indicator for MT5 combines the Relative Strength Index (RSI) with stochastic calculations to highlight overbought and oversold conditions.
It helps identify changes in momentum that may signal a potential reversal, a short-term pullback, or a continuation of the prevailing trend.
The indicator displays a main oscillator line with values generally ranging from 0 to 100, together with adjustable overbought and oversold levels.
Its color changes help distinguish different momentum conditions, making it useful for analyzing price movements across multiple timeframes.
Why traders use the Double Stochastic RSI Indicator
Combining RSI and stochastic calculations provides a momentum-based view of the market.
The indicator helps identify when buying or selling pressure may be becoming stretched and highlights moments when momentum moves away from extreme readings.
These readings can support entry decisions when combined with price action, support and resistance levels, or a trend filter.
The indicator does not predict every reversal, and extreme readings can persist during strong trends. Confirmation from price structure is therefore important.
Download This MT5 Indicator for Free
Indicator Chart Setup
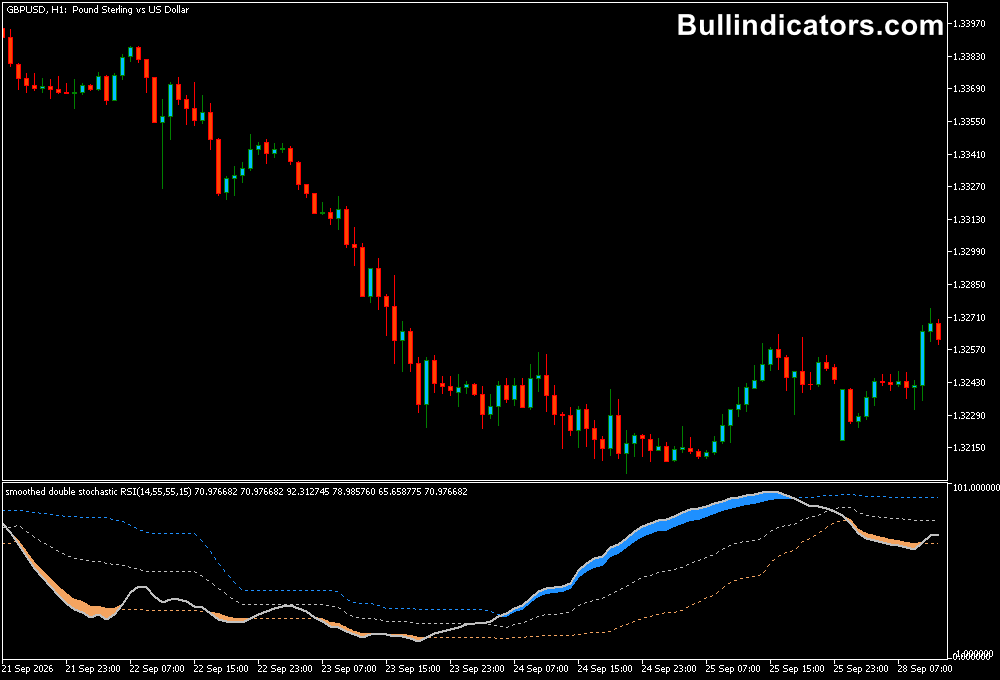
The Double Stochastic RSI appears in a separate indicator window beneath the main price chart.
Its oscillator line moves between the lower and upper boundaries, while horizontal levels mark the overbought and oversold zones.
When the line rises above the overbought level, it changes to blue by default.
This can indicate strong bullish momentum or an extended upward move.
When the line drops below the oversold level, it turns orange, highlighting weak momentum or potentially stretched selling pressure.
Colors can be customized in the indicator settings.
A potential buy setup develops when the oscillator moves back above the oversold threshold and price confirms bullish conditions.
A potential sell setup occurs when it moves down from the overbought zone and price action supports a bearish move.
Core Features
- Double stochastic-based momentum analysis using RSI calculations.
- Overbought and oversold levels for identifying extreme readings.
- Color-changing oscillator line for distinguishing momentum conditions.
- Adjustable RSI, stochastic, and smoothing periods.
- Non-repainting behavior, according to the supplied indicator description.
- Suitable for combining with price action and trend analysis.
Best for
- Identifying potential momentum reversals after extended price moves.
- Spotting pullbacks within established trends.
- Confirming entries around previous swing highs, swing lows, and key price levels.
- Filtering potential setups with candlestick patterns or moving averages.
Best Markets
- EURUSD: Liquid conditions suitable for intraday momentum analysis.
- GBPUSD: Useful for monitoring fast momentum changes during active sessions.
- USDJPY: Suitable for assessing pullbacks and short-term directional shifts.
- XAUUSD (Gold): Can help identify stretched momentum, although sharp price swings require careful risk management.
- Major cryptocurrency pairs: Applicable to volatile markets, subject to confirmation and appropriate position sizing.
Trading Styles
- Scalping: M1 and M5 charts for short-term setups, preferably during liquid market sessions.
- Intraday trading: M5, M15, and M30 charts for pullbacks and momentum shifts.
- Swing trading: H1 and H4 charts for broader price movements.
- Trend-following: Use H1 or H4 to establish direction, then look for momentum resets on lower timeframes.
How traders use it
For a buy setup, wait for the oscillator to move out of oversold territory, then look for bullish confirmation such as a higher low, a bullish rejection candle, or a break above nearby resistance.
A sell setup follows the opposite logic: the oscillator retreats from overbought territory while price action confirms bearish pressure.
For scalping, apply the indicator to an M1 or M5 chart on a liquid pair such as EURUSD or GBPUSD.
During the London or New York session, monitor the oscillator for a move back out of an extreme zone.
Before entering, check whether price is reacting to a recent support or resistance level and whether the broader short-term direction supports the trade.
For example, if the oscillator leaves oversold territory on EURUSD M5 and price forms a bullish rejection near support, a long setup may be worth evaluating.
A stop-loss can be placed below the recent swing low, with the profit target based on nearby resistance and the intended risk-to-reward ratio.
Reverse these conditions for a short trade.
Avoid entering solely because the oscillator reaches an extreme reading, as momentum can remain overbought or oversold during strong moves.
Get Instant Free Access
Indicator Settings
- RSI Period: Sets the calculation period used by the Relative Strength Index.
- RSI applied to price: Determines the price input used for the RSI calculation.
- Stochastic period 1: Defines the first stochastic calculation period.
- Stochastic period 2: Sets the second stochastic calculation period.
- Smoothing period: Controls smoothing of the stochastic calculation and influences the oscillator’s responsiveness.
Important Notes
- Overbought and oversold readings do not guarantee a reversal.
- Use support and resistance, candle patterns, or trend analysis to filter potential entries.
- Shorter settings may react faster but can generate more false signals, particularly on M1 charts.
- The indicator does not include alerts according to the supplied description.
- Always use a defined stop-loss and test the settings on historical data and a demo account before live trading.