
The Stoch RSI indicator for MetaTrader 5 combines two of the most widely used momentum indicators into a single trading tool.
By applying the Stochastic formula to the Relative Strength Index (RSI), the indicator reacts faster to changes in market momentum and provides earlier buy and sell signals than using either indicator independently.
The indicator is designed to highlight overbought and oversold market conditions while filtering out many of the weaker signals produced by traditional oscillators.
It is suitable for beginners looking for straightforward entry signals as well as experienced traders who want additional confirmation before entering a position.
Since the indicator does not repaint after a candle closes, it can also be incorporated into automated trading systems.
Why Traders Use the Stoch RSI Indicator
Momentum often changes before price fully reverses, making oscillators valuable for spotting potential turning points.
The Stoch RSI reacts quickly to these momentum shifts and helps traders identify when buying or selling pressure begins to increase.
Many traders use the indicator to time pullback entries during trends or to identify exhaustion after extended market moves.
The combination of RSI and Stochastic calculations creates fewer but generally higher-quality trading opportunities compared to using the standard RSI or Stochastic separately.
Download This MT5 Indicator for Free
Indicator Chart Setup
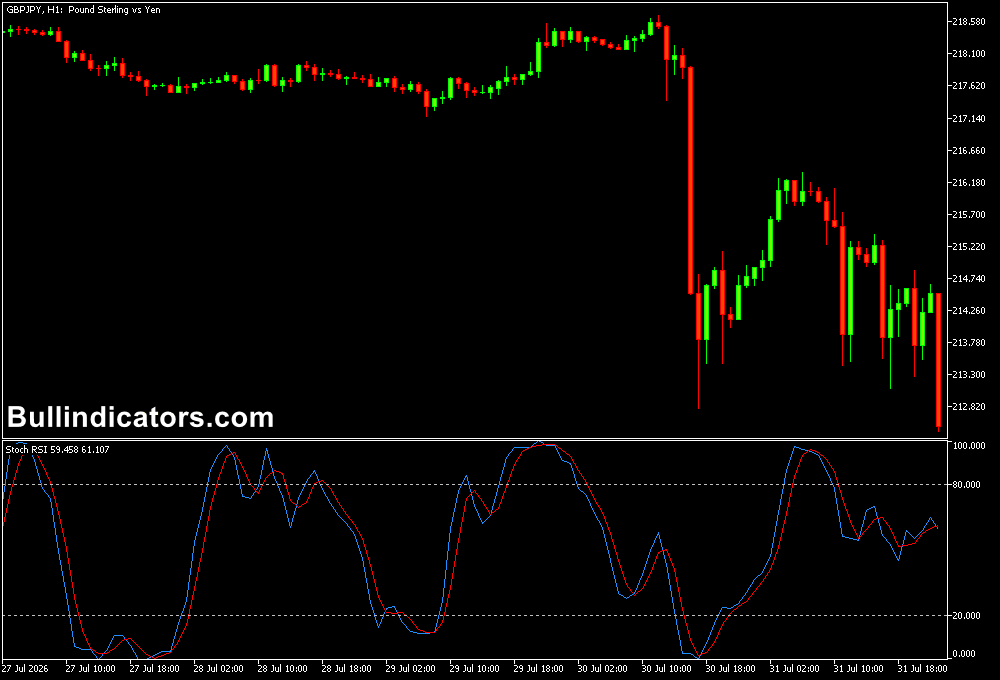
The indicator appears in a separate window below the price chart.
The blue Stochastic lines move together with the red RSI line between predefined overbought and oversold levels.
When all lines rise from the oversold zone, bullish momentum is strengthening.
Likewise, when they turn lower from the overbought zone, bearish momentum is beginning to dominate.
Core Features
- Combines RSI and Stochastic into one momentum indicator.
- Highlights overbought and oversold market conditions.
- Provides faster momentum signals than the traditional RSI.
- Suitable for manual and automated trading strategies.
- Works across all MT5 timeframes and financial markets.
- Does not repaint after candle close.
Best for
- Momentum trading.
- Finding pullback entries.
- Trend continuation setups.
- Scalping volatile forex pairs.
- Confirming reversal opportunities.
Best Markets
- EURUSD on M5 and M15 during the London session.
- GBPJPY where momentum changes can develop rapidly.
- EURJPY for intraday pullback trading.
- GBPUSD during active market hours.
- XAUUSD (Gold) for momentum-based scalping.
- NAS100 during the New York session.
Trading Styles
- Forex scalping on M1 and M5.
- Intraday momentum trading on M15.
- Trend-following strategies on H1.
- Swing trading using H4 confirmations.
- Multi-timeframe momentum analysis.
How Traders Use It
While the Stoch RSI is excellent at identifying overbought and oversold conditions, momentum signals become much more reliable when they align with the overall market trend. One effective way to filter trades is by combining the indicator with the Trend Magic Indicator for MT5.
The Trend Magic line acts as the trend filter, while the Stoch RSI is used to time entries during pullbacks.
Example Scalping Strategy: Stoch RSI + Trend Magic Indicator
Find below the BUY and SELL rules for this simple scalping strategy.
BUY Setup
- Trade on the M5 timeframe.
- Only consider BUY trades when the Trend Magic line is blue, indicating an established uptrend.
- Wait for the Stoch RSI to decline below the 20 oversold level during the pullback.
- Enter a BUY position once the Stoch RSI lines cross upward and move back above the oversold zone.
- Place the stop loss below the most recent swing low.
- Take profit at the next resistance level or target a minimum risk-to-reward ratio of 1:2.
SELL Setup
- Trade on the M5 timeframe.
- Only consider SELL trades when the Trend Magic line is red, confirming a downtrend.
- Wait for the Stoch RSI to rise above the 80 overbought level during a temporary rally.
- Enter a SELL position once the Stoch RSI lines cross downward and move back below the overbought zone.
- Place the stop loss above the most recent swing high.
- Take profit at the nearest support level or target a minimum risk-to-reward ratio of 1:2.
This approach focuses on trading pullbacks within an established trend rather than attempting to catch reversals.
By using Trend Magic to define the market direction and the Stoch RSI to time entries, traders can avoid many counter-trend signals while improving the overall quality of their setups.
Get Instant Free Access
Indicator Settings
- K: K period used for the Stochastic calculation.
- D: Signal smoothing period for the Stochastic indicator.
- RSI Period: Number of bars used to calculate the Relative Strength Index.
- Stochastic Period: Defines the calculation period of the Stochastic component.
Important Notes
- Trade in the direction of the prevailing trend whenever possible.
- Overbought does not always mean price will immediately fall, and oversold does not guarantee an immediate rally.
- The indicator performs best on liquid markets with consistent momentum.
- Always wait for the crossover to complete before entering a trade.
- Test different period settings to match your preferred trading style.
- Combine the indicator with price action or trend filters for higher-probability setups.









