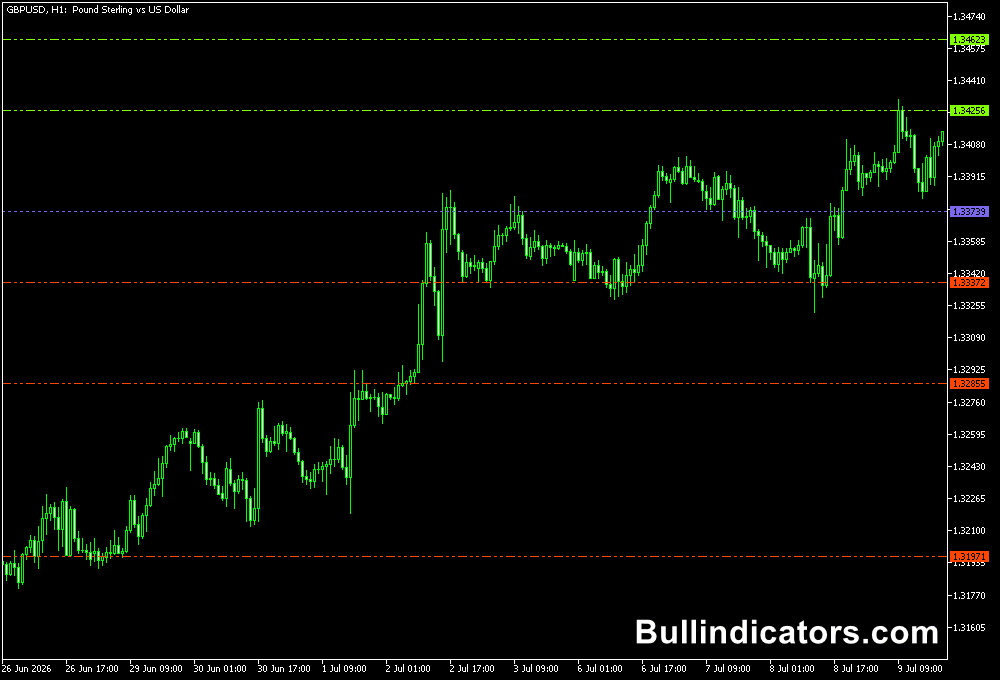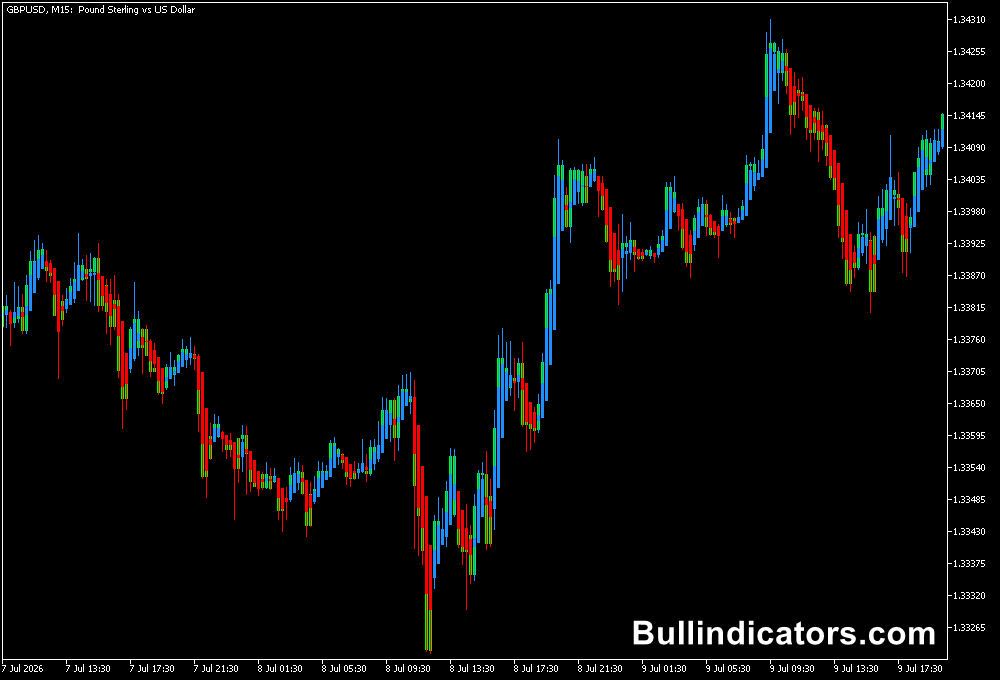
The Awesome Oscillator Indicator for MT5 is a momentum analysis tool that helps identify changes in market strength and potential shifts in trend direction.
It displays a colored histogram in a separate chart window, allowing you to evaluate whether bullish or bearish momentum is increasing or weakening.
The indicator compares short-term and longer-term price momentum to show changes in market conditions.
Positive readings indicate bullish momentum, while negative readings suggest bearish pressure.
Changes in histogram height and color can provide additional information about whether the current move is gaining strength or losing momentum.
The Awesome Oscillator is useful for forex day trading, scalping, and swing trading.
It can help confirm breakouts, assess the strength of an existing trend, and identify situations where momentum begins to weaken.
Combining its readings with price action and support and resistance levels provides additional context for evaluating potential trades.
Why Traders Use the Awesome Oscillator Indicator
Price direction alone does not always reveal whether a move has sufficient momentum to continue.
The Awesome Oscillator helps address this by presenting momentum changes in a visual format that is easy to compare with price action.
When the histogram rises and positive readings increase, bullish momentum is strengthening.
When the bars begin shrinking, the upward move may be losing strength.
The same principle applies to bearish conditions, where increasingly negative readings indicate growing downward momentum.
Another useful application is trade management.
A change in histogram direction can alert you to weakening momentum, prompting a review of an existing position.
A move through the zero line provides another reference for assessing whether momentum has shifted to the opposite side.
Download This MT5 Indicator for Free
Indicator Chart Setup
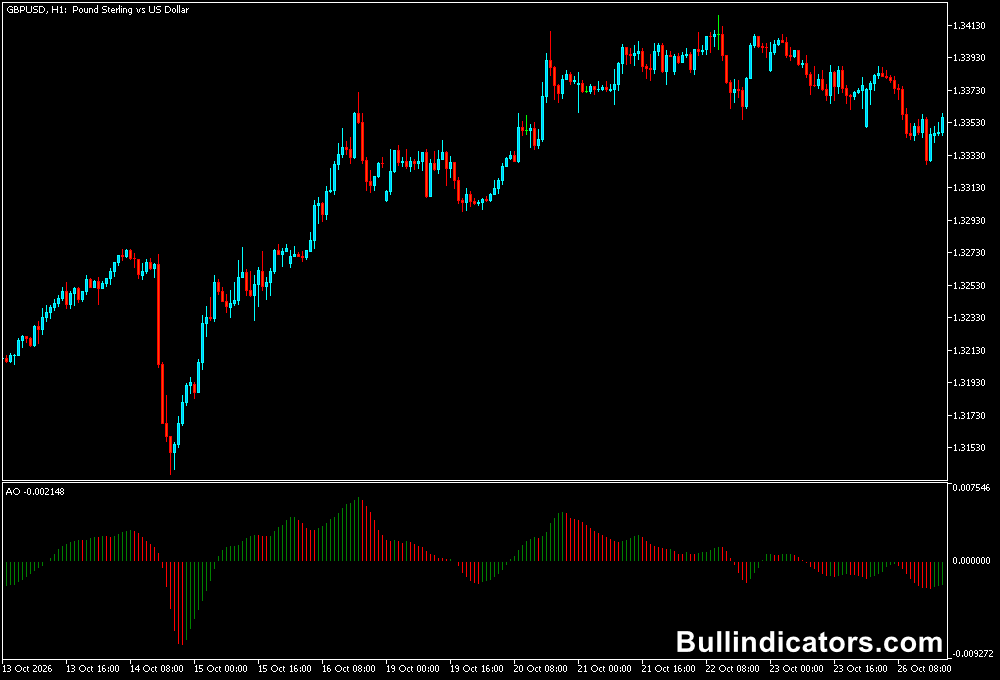
The Awesome Oscillator appears in a separate window beneath the main price chart.
It uses colored histogram bars arranged around a horizontal zero line to represent changes in momentum.
Green bars indicate positive or strengthening bullish momentum, while red bars indicate weakening bullish momentum or bearish conditions, depending on the histogram’s position relative to zero.
The relationship between the bar colors and the zero line is important when interpreting a signal.
For example, rising green bars above zero indicate that bullish momentum is increasing.
If the bars begin shrinking and turn red while remaining above zero, the upward move may be losing strength.
When the histogram crosses below zero, bearish momentum becomes more prominent.
During a downtrend, increasingly negative readings can support a bearish outlook.
Core Features
- Displays bullish and bearish momentum through a colored histogram.
- Uses a zero line to distinguish positive and negative momentum.
- Highlights increasing or decreasing momentum through changes in bar height.
- Helps identify potential trend continuation and reversal conditions.
- Supports entry confirmation and trade management.
- Provides customizable histogram colors.
Best For
- Confirming momentum during bullish and bearish breakouts.
- Identifying weakening momentum before deciding whether to hold or close a position.
- Filtering entry signals generated by price action strategies.
- Monitoring potential changes in trend direction.
- Evaluating whether a pullback may be developing within an existing trend.
Best Markets
- EURUSD: Analyze momentum during London and New York trading sessions.
- GBPJPY: Monitor strong directional moves and potential momentum reversals during active market hours.
- USDJPY: Evaluate intraday momentum during Asian and US sessions.
- XAUUSD (Gold): Assess momentum during breakouts and periods of increased volatility.
- Major stock indices: Apply momentum analysis to instruments such as the S&P 500 and Nasdaq when supported by your broker.
Trading Styles
- Scalping: Use M1 and M5 charts to assess short-term momentum and confirm potential entries.
- Day trading: Apply the indicator to M5 and M15 charts to monitor intraday breakouts and changes in momentum.
- Trend following: Use M30 and H1 charts to evaluate whether momentum supports the prevailing direction.
- Swing trading: Analyze H4 charts to monitor broader momentum changes and possible trend transitions.
How Traders Use the Awesome Oscillator Indicator
A practical approach is to compare the histogram with the direction of price action. When the oscillator is positive and rising, bullish setups receive priority.
When readings are negative and falling, bearish setups receive priority.
For a potential buy, look for a bullish breakout or a pullback that finds support while the histogram confirms improving momentum.
For a potential sell, look for a bearish breakdown or rejection from resistance accompanied by weakening or negative momentum.
Some traders also monitor changes in bar height to manage open positions.
Shrinking bars can indicate that the current move is losing strength, while a zero-line cross may provide further evidence of a momentum shift.
Neither condition should be treated as an automatic exit signal without considering the original trade setup and nearby price levels.
Buy Entry Example
- Market condition: EURUSD approaches resistance and then breaks above it with a bullish candle.
- Awesome Oscillator: The histogram moves above zero, with green bars increasing in height.
- Entry: Consider a buy after the breakout is confirmed and the oscillator supports the bullish move.
- Stop-loss: Place the stop below the breakout level or a recent swing low, depending on the price structure.
- Take-profit: Target the next resistance level or use a predefined risk-to-reward ratio.
Sell Entry Example
- Market condition: GBPUSD rejects resistance and breaks below a nearby support level.
- Awesome Oscillator: The histogram moves below zero, with red bars extending further into negative territory.
- Entry: Consider a sell after the bearish breakdown is confirmed by price action and momentum.
- Stop-loss: Position the stop above the rejection high or another technically justified invalidation level.
- Take-profit: Identify the next support level or establish a target based on the initial risk.
Get Instant Free Access
Indicator Settings
- Colors: Customize the histogram colors to improve visibility and distinguish bullish and bearish momentum conditions on your chart.
Important Notes
- The Awesome Oscillator is a lagging momentum tool and may confirm a move after price has already started moving.
- Histogram color changes should be interpreted alongside the zero line. A red bar above zero does not necessarily indicate an established bearish trend.
- Sideways markets can produce frequent changes in momentum and unreliable entry signals.
- Combine the indicator with support and resistance, trend analysis, or price action to improve the context of trading decisions.