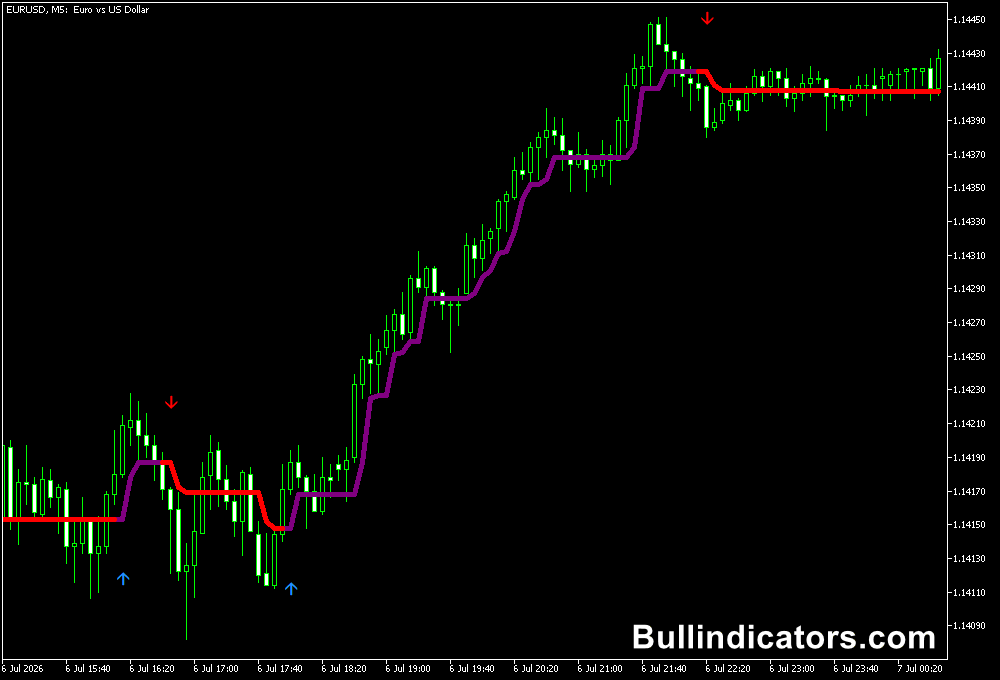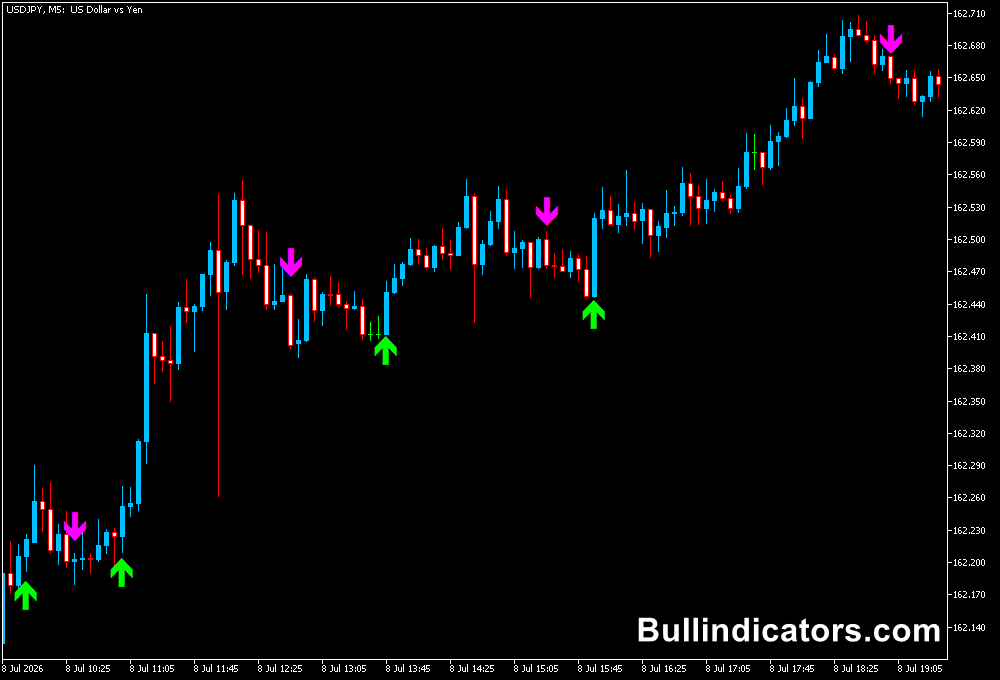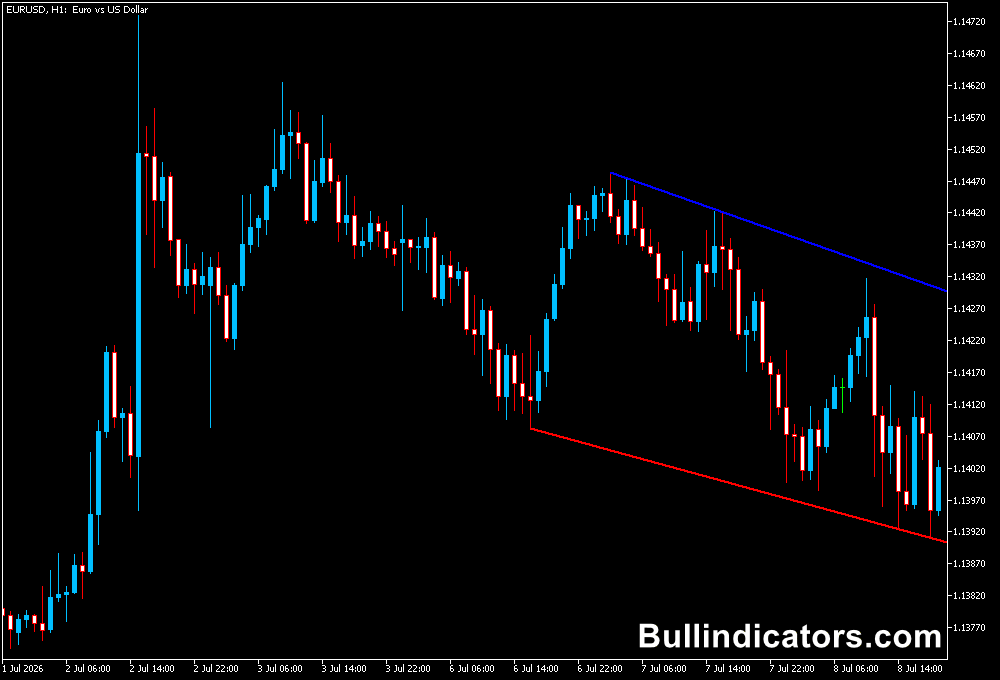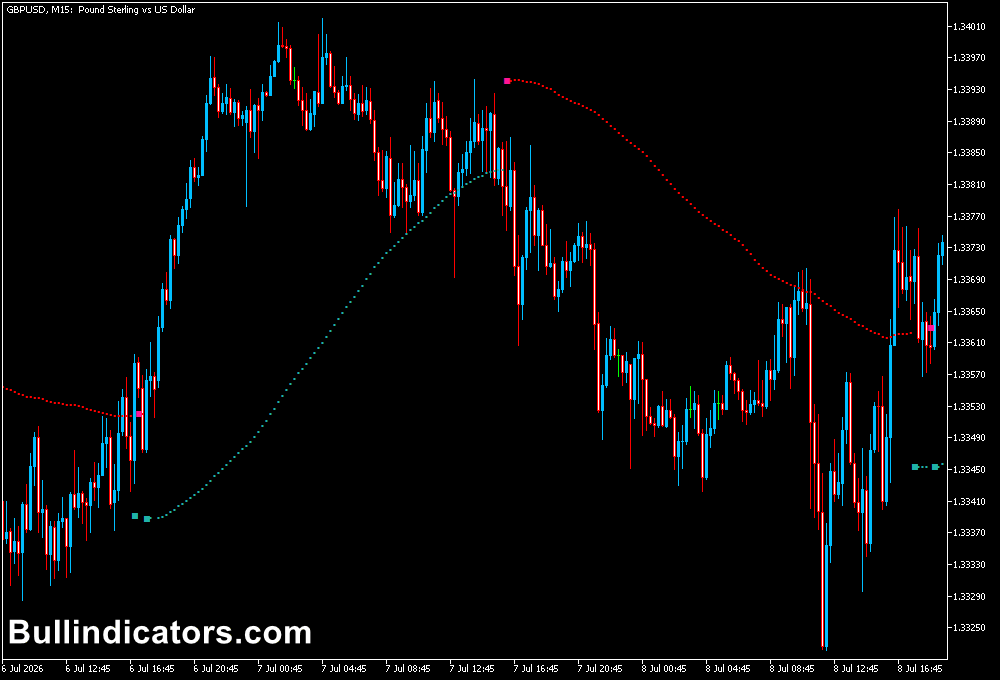
The Solar Winds indicator for MT5 is a trend-following tool that displays potential bullish and bearish market conditions through a colored histogram.
It helps identify changes in directional momentum, allowing you to assess whether the market favors buying or selling opportunities.
Green histogram bars represent bullish conditions, while red bars indicate bearish conditions.
A change from red to green can signal a potential upward shift, while a transition from green to red may indicate increasing selling pressure.
The Solar Winds Indicator can support trend-following strategies, intraday analysis, and trade management.
Combining it with price action, support and resistance, or another trend confirmation tool can help you evaluate potential entries more effectively.
Why Traders Use the Solar Winds Indicator
Identifying changes in market direction can be challenging when price fluctuates around important levels.
The Solar Winds Indicator simplifies this process by displaying directional conditions through a histogram, making it easier to monitor changes in momentum without relying exclusively on individual candlesticks.
A transition from red to green highlights a potential bullish shift, while a change from green to red suggests a possible bearish move.
These color changes provide a visual reference for evaluating new trading opportunities and reviewing existing positions.
The indicator also includes adjustable calculation and smoothing parameters, allowing you to modify how its readings respond to market movements.
Download This MT5 Indicator for Free
Indicator Chart Setup
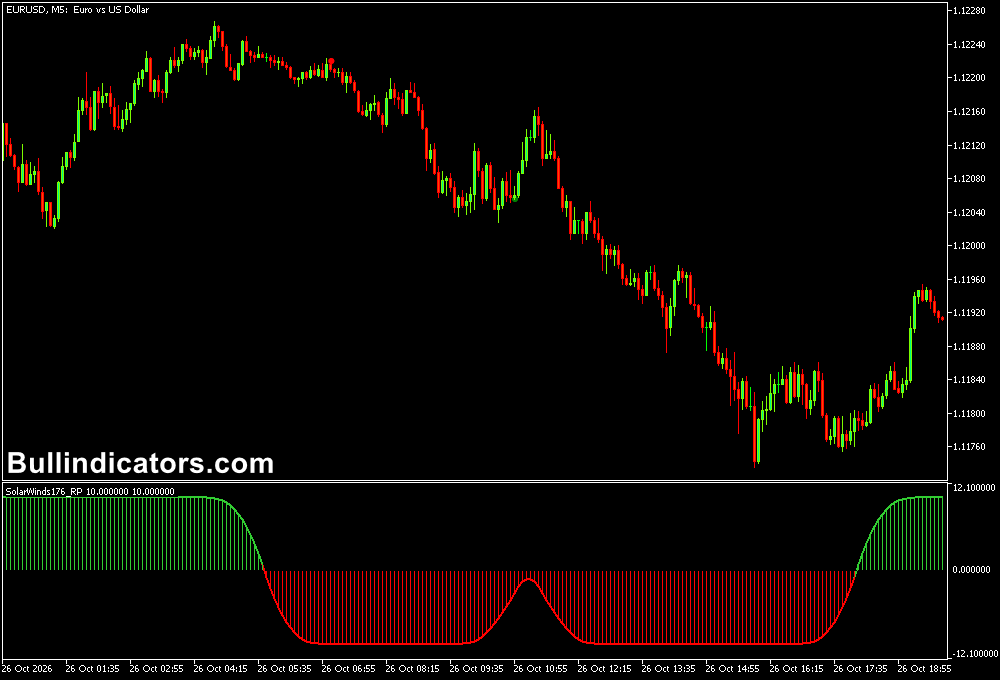
The Solar Winds Indicator displays a histogram in a separate window below the price chart.
Its green and red bars provide a visual representation of the indicator’s current directional reading.
When the histogram changes from red to green, the indicator suggests a potential bullish condition.
A transition from green to red indicates a possible shift toward bearish conditions.
Observing consecutive bars can help you assess whether the current reading persists or changes shortly after appearing.
For example, on an EURUSD H1 chart, a transition to green while price breaks above resistance may support a bullish interpretation.
If the histogram turns red as price falls below support, the combination may indicate growing bearish pressure.
Core Features
- Displays potential bullish and bearish conditions using a colored histogram.
- Highlights changes in directional momentum through color transitions.
- Provides adjustable calculation period and smoothing parameters.
- Includes configurable indicator alerts.
- Supports email notifications when enabled and properly configured.
- Can be combined with price action and other technical indicators for additional confirmation.
Best For
- Monitoring potential changes in trend direction.
- Confirming directional conditions alongside support and resistance levels.
- Filtering entry opportunities within a broader trend-following strategy.
- Reviewing potential exits when the histogram changes color.
- Receiving alerts when indicator conditions change.
Best Markets
- EURUSD: Monitor directional conditions during the London and New York sessions.
- GBPUSD: Evaluate potential trend changes during periods of strong intraday movement.
- USDJPY: Examine bullish and bearish conditions during Asian and US trading hours.
- XAUUSD (Gold): Assess directional changes during breakouts and volatile market periods.
- Major stock indices: Use the histogram to study directional conditions where the instrument and broker support MT5 trading.
Trading Styles
- Trend following: Use H1 and H4 charts to evaluate broader directional conditions.
- Day trading: Apply the indicator to M15 and M30 charts, confirming signals with price structure.
- Intraday swing trading: Use M30 and H1 charts to monitor potential trend changes that may develop over several candles.
- Position management: Observe changes in histogram color when assessing whether to maintain or close an existing trade.
How Traders Use the Solar Winds Indicator
A basic approach is to monitor changes in histogram color and compare them with the prevailing market structure.
A transition from red to green can prompt a search for bullish entries, while a transition from green to red can encourage a search for bearish setups.
For a potential buy, look for a green histogram alongside a bullish breakout, a higher low, or a successful retest of support.
For a potential sell, look for red bars alongside a bearish breakdown, a lower high, or rejection from resistance.
Some traders also monitor the histogram when managing an open position.
A change to the opposite color can prompt a review of the trade, but it should not automatically trigger an exit without considering the entry conditions, stop-loss, and current price structure.
Buy Entry Example
- Market condition: EURUSD is approaching resistance after forming higher lows.
- Solar Winds: The histogram changes from red to green.
- Price confirmation: A bullish candle closes above resistance, suggesting a potential breakout.
- Entry: Consider a buy after the breakout is confirmed and the setup remains valid.
- Stop-loss: Place the stop below the recent swing low or another technically justified invalidation level.
- Exit: Consider taking profit at the next resistance level or when your predefined risk-to-reward target is reached.
Sell Entry Example
- Market condition: GBPUSD rejects resistance and begins forming lower highs.
- Solar Winds: The histogram changes from green to red.
- Price confirmation: A bearish candle closes below nearby support.
- Entry: Consider a sell after the breakdown is confirmed and the market structure supports the bearish setup.
- Stop-loss: Position the stop above the recent swing high or another technically justified invalidation level.
- Exit: Consider the next support level or a predefined risk-to-reward target.
Get Instant Free Access
Indicator Settings
- Period: Sets the number of historical bars used in the indicator’s calculation. The selected value can influence how its readings respond to price changes.
- Smooth: Controls the smoothing applied to the indicator. Adjusting this parameter may change the responsiveness of the histogram.
- DoAlert: Enables or disables indicator alerts.
- alertMail: Enables or disables email notifications. Your MT5 email configuration must be set up correctly for email alerts to work.
Important Notes
- The Solar Winds Indicator can repaint, meaning previously displayed signals may change as new price data arrives. Do not assume historical signals were fixed when first generated.
- Green and red bars indicate potential directional conditions, not guaranteed price movements.
- Confirm signals with price action, support and resistance, or another independent analytical method.
- Lower timeframes can produce frequent changes and more opportunities for misleading signals. Test the indicator on your intended timeframe before using it live.
- Use a predefined stop-loss and appropriate position sizing. Backtest and forward-test the indicator before incorporating it into a live trading strategy.