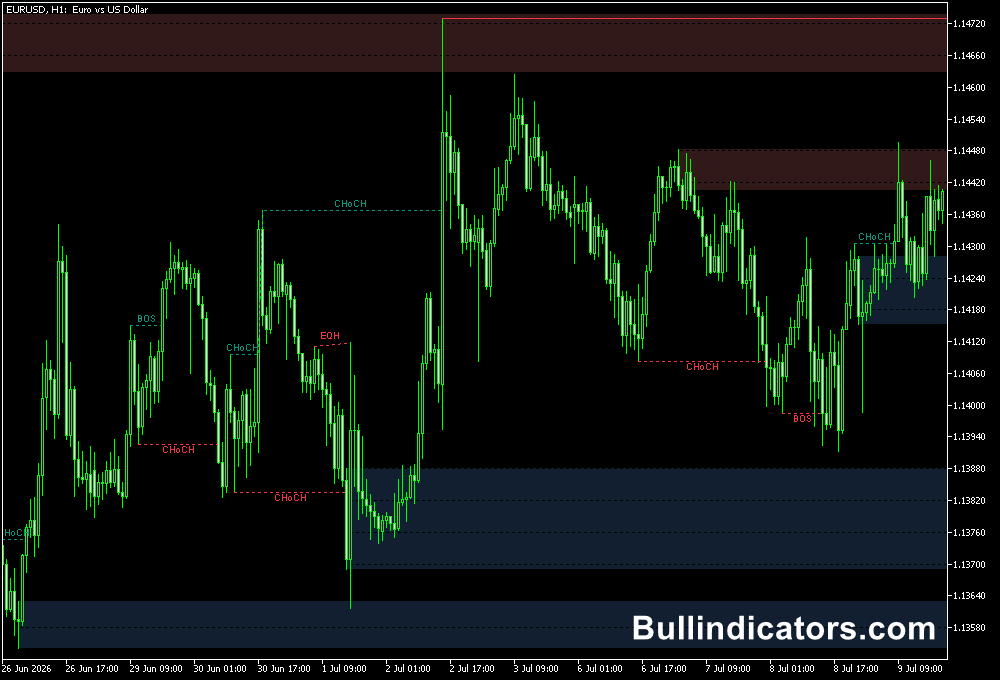
The Shved Supply and Demand v1.2 indicator for MT5 helps traders identify important price zones where buying or selling pressure has previously caused strong market moves.
These supply and demand areas often attract attention when price returns, making them valuable locations for planning trade entries, exits, or waiting for confirmation.
The indicator automatically marks different zone types and provides descriptive labels, allowing traders to quickly evaluate the strength of each area.
It is particularly useful for traders who rely on price action and market structure rather than lagging signals.
Why traders use the Shved Supply and Demand v1.2 indicator
Supply and demand trading remains one of the most widely used approaches because markets frequently react around institutional buying and selling zones.
The Shved Supply and Demand_v1.2 indicator simplifies this analysis by automatically locating and classifying these areas according to their trading history and reliability.
Traders appreciate that the indicator distinguishes between weaker and stronger zones, making it easier to focus on higher-probability opportunities.
It also identifies mirror levels where previous resistance becomes support or previous support becomes resistance after a breakout.
Many traders combine these zones with candlestick formations, trend analysis, or momentum indicators to improve trade timing and filter weaker setups.
Download This MT5 Indicator for Free
Indicator Chart Setup
After attaching the indicator, colored supply and demand zones appear directly on the price chart.
Each zone includes a short text label that identifies its classification, making it easy to understand its significance without additional analysis.
Proven and verified zones often display retest information, allowing traders to quickly judge how frequently price has reacted from the area.
The indicator continuously updates the zones as new price action develops while keeping the chart organized and easy to read.

Core Features
- Automatically detects supply and demand zones.
- Classifies zones by their strength and reliability.
- Displays weak, untested, verified, proven, and turncoat zones.
- Shows descriptive labels directly on the chart.
- Supports optional fractal detection.
- Allows extensive visual customization.
Best for
- Finding high-probability reversal areas.
- Planning support and resistance trades.
- Price action trading.
- Breakout and retest strategies.
- Trade entry and exit planning.
Best Markets
- Major Forex pairs including EUR/USD, GBP/USD, USD/JPY, and USD/CHF.
- Cross pairs such as EUR/JPY, GBP/JPY, and AUD/JPY.
- Gold (XAU/USD) and Silver (XAG/USD).
- Stock indices including NASDAQ 100, DAX 40, and S&P 500.
- Other liquid CFD markets with consistent price movement.
Trading Styles
- Swing trading.
- Day trading.
- Forex scalping on M1/M5.
- Breakout trading.
- Price action trading.
How traders use it
Many traders monitor price as it approaches a supply or demand zone before looking for confirmation through candlestick patterns or momentum signals.
Untested and verified zones often receive the most attention because they have a higher chance of producing fresh reactions.
Proven zones can remain significant even after multiple tests, while turncoat zones help traders identify important role reversals following breakouts.
Higher timeframes generally provide stronger zones by reducing short-term market noise.
Get Instant Free Access
Indicator Settings
- Zone show weak – Enables or disables displaying weak supply and demand zones.
- Zone show untested – Shows or hides untested zones that have not yet been revisited.
- Zone show turncoat – Displays or hides mirror zones where support and resistance have switched roles.
- Zone fuzzfactor – Adjusts the height and sensitivity of the plotted supply and demand zones.
- Fractals show – Enables or disables fractal markers on the chart.
- Fractal fast factor – Controls the faster fractal detection calculation.
- Fractal slow factor – Controls the slower fractal detection calculation for additional filtering.
- Zone solid – Sets the overall width of the displayed zones.
- Zone line width – Changes the thickness of the zone boundary lines.
- Zone style – Selects the line style used for drawing supply and demand zones.
- Zone show info – Enables or disables text labels that describe each identified zone.
Important Notes
- Higher timeframe zones generally provide more reliable trading opportunities.
- Combine the zones with candlestick analysis or trend confirmation for stronger entries.
- Repeatedly tested proven zones often remain important until a decisive breakout occurs.
- Turncoat zones can become valuable support or resistance after trend changes.
- Always wait for price confirmation before opening a position.