
The TMA Centered Bands indicator for MT5 is a trend-following and price channel indicator built around Triangular Moving Averages (TMA).
It plots three dynamic bands directly on the MetaTrader 5 chart to help traders identify the prevailing trend, potential reversal zones, and areas where price may become overextended.
The upper band is displayed in pink, the lower band in light blue, while the center band changes color to reflect the current market direction.
As price moves between the bands, traders can quickly evaluate whether the market is approaching an area where momentum may weaken or where a new trend could begin.
The indicator is suitable for multiple timeframes and can be used as a standalone trading tool or combined with confirmation indicators such as RSI or moving averages for higher-probability trade setups.
Why traders use the TMA Centered Bands Indicator
Many traders use the TMA Centered Bands Indicator because it combines trend analysis with dynamic support and resistance levels.
The bands adapt to changing market conditions, allowing traders to recognize when price is stretched beyond its normal range.
The changing color of the middle band provides an additional trend filter, making it easier to avoid trading against the prevailing market direction.
The indicator also works well across different market conditions and can be applied to short-term trading as well as longer-term trend analysis.
Since the bands are based on triangular moving averages, they react smoothly to price movements while filtering a significant amount of market noise.
Download This MT5 Indicator for Free
Indicator Chart Setup
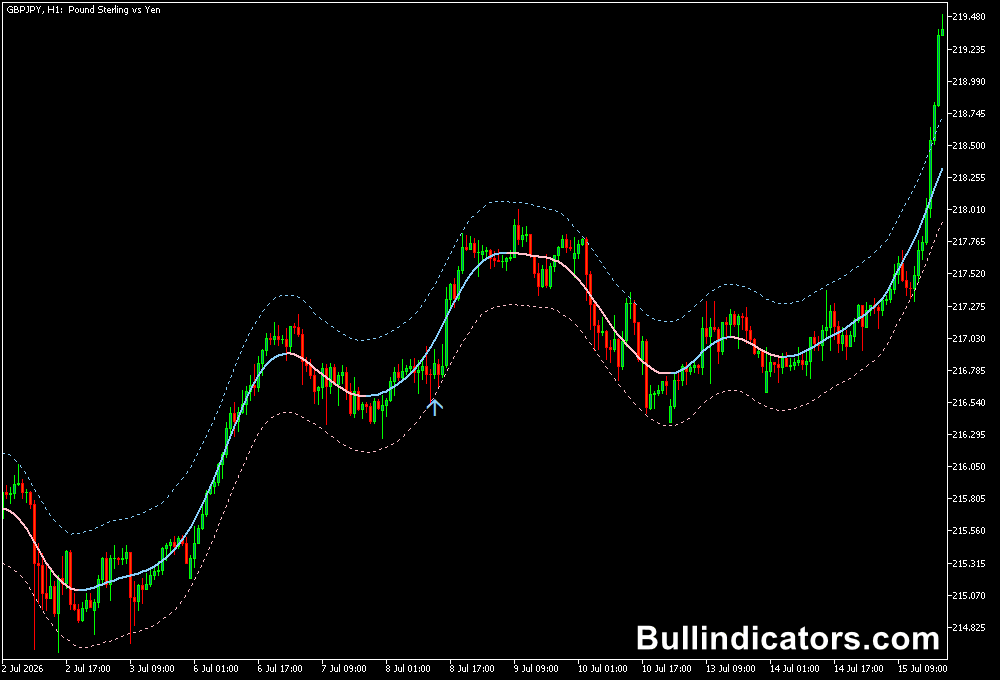
Once applied to the MT5 chart, the indicator displays three moving average bands surrounding price action.
The upper band is colored pink and highlights potential overbought conditions.
The lower band appears in light blue and marks possible oversold areas.
The center band switches between light blue during bullish trends and pink during bearish trends, providing a simple visual indication of trend direction.
As price approaches or crosses the outer bands, traders monitor the market for possible reversals while using the center band to confirm the dominant trend.
Core Features
- Triangular Moving Average based channel
- Dynamic upper, middle, and lower bands
- Color-changing center line for trend confirmation
- Highlights potential reversal zones
- Works on all MT5 timeframes
- Suitable for combining with other technical indicators
Best for
- Trend identification
- Reversal trading
- Mean reversion strategies
- Support and resistance analysis
- Trade timing and market filtering
Best Markets
- Major Forex pairs
- Minor currency pairs
- Gold (XAUUSD)
- Indices
- Commodities
- Cryptocurrency CFDs
Trading Styles
- Scalping on M1 and M5 charts
- Day trading the M15 and M30 charts
- Swing trading on H1 and H4 charts
How traders use it
Traders typically look for buying opportunities after price falls below the lower band and begins to recover while the market shows signs of renewed bullish momentum.
A protective stop loss is commonly placed below the recent swing low, and many traders exit the position when the center band changes from light blue to pink.
For short positions, traders monitor situations where price rises above the upper band before showing signs of weakness.
After bearish confirmation appears, they enter a sell trade with a stop loss above the recent swing high.
The trade is often closed when the center band shifts from pink to light blue, suggesting bearish momentum may be fading.
Many experienced traders improve signal quality by combining the TMA Centered Bands Indicator with RSI, moving averages, or price action confirmation before entering a position.
Get Instant Free Access
Indicator Settings
- TMA Period: Default value 12. This setting controls the half-length of the Triangular Moving Average used to calculate the bands. Lower values make the bands react faster to price changes, while higher values create smoother bands that focus on longer-term market direction.
- ATR Period: Default value 100. This setting determines how the Average True Range is calculated for the band width. Larger values produce more stable channel widths by averaging volatility over a longer period, while smaller values allow the bands to adjust more quickly to changing market volatility.
Important Notes
- Price moving outside the bands does not guarantee an immediate reversal.
- Use the center band color as an additional trend confirmation filter.
- Combine with momentum or confirmation indicators to reduce false signals.
- The indicator performs well on all timeframes but should always be tested with your trading strategy.
- Always apply proper risk management and use protective stop losses.









