
The Fractal Support Resistance indicator for MT5 is an automated technical analysis tool that identifies important horizontal price levels using fractal market structures.
It analyzes previous highs and lows to create support and resistance zones where price has historically shown strong reactions.
Manually drawing support and resistance levels can be subjective and time-consuming, especially when monitoring multiple instruments.
This indicator simplifies the process by automatically connecting significant fractal points and creating clear price channels that traders can use for reversal setups, breakout opportunities, and intraday market analysis.
This tool is designed for traders who rely on price action and market structure.
Since the levels are based on confirmed fractal points, the displayed zones provide a reliable framework for analyzing where buyers and sellers may become active.
Why traders use the Fractal Support Resistance Indicator
Support and resistance levels remain some of the most important concepts in technical trading.
They show areas where price previously reacted and where future market decisions may develop.
The Fractal Support Resistance Indicator automatically highlights these areas, helping traders avoid inconsistent manual chart marking.
The indicator is especially useful for intraday traders who need fast access to key levels before entering a position.
It can reveal potential reversal zones, breakout points, and areas where price may consolidate.
Traders often combine these levels with candlestick formations such as pin bars, engulfing patterns, or momentum confirmation to improve trade selection.
Download This MT5 Indicator for Free
Indicator Chart Setup
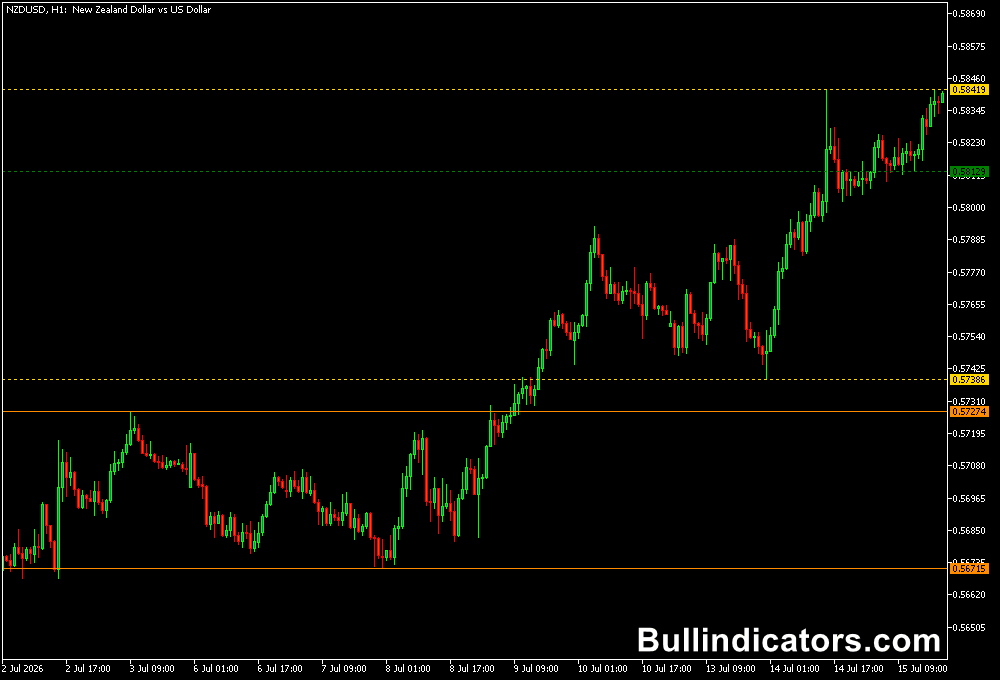
After applying the indicator to an MT5 chart, automated fractal support and resistance lines appear around important market turning points.
The indicator connects relevant fractal highs and lows to create horizontal price channels.
These levels remain fixed after confirmation, allowing traders to monitor reactions without constantly adjusting manually drawn zones.
Higher timeframe fractal levels can act as major market reference points, while lower timeframe levels help identify intraday trading opportunities.
When price approaches these areas, traders can watch for rejection candles, consolidation breaks, or strong momentum moves.
Core Features
- Automatic support and resistance detection
- Fractal-based price channel calculation
- Non-repainting confirmed levels
- Multi-timeframe compatibility
- Suitable for reversal and breakout analysis
- Customizable visual display
Best for
- Identifying key market levels
- Breakout trading strategies
- Price action setups
- Intraday support and resistance analysis
- Planning entry and exit areas
Best Markets
- EUR/USD, GBP/USD, and USD/JPY
- GBP/JPY and other volatile currency pairs
- Gold (XAU/USD)
- Major indices such as NAS100 and US30
- Commodity markets
- Liquid cryptocurrency markets
Trading Styles
- Intraday level-based trading
- Breakout and retest strategies
- Support and resistance scalping
- Swing trading using higher timeframe zones
- Price action confirmation trading
- Market structure analysis
How traders use it
One popular method is to wait for price to reach a fractal support or resistance level before searching for confirmation.
For example, when EUR/USD approaches a fractal support zone and forms a bullish pin bar, traders may consider a long position with a stop loss below the support area.
The same principle applies to resistance zones. If price reaches a fractal resistance level and creates bearish rejection, traders may look for short opportunities.
These setups become stronger when the signal aligns with the overall market trend or a higher timeframe level.
The indicator can also be used for breakout trading.
When price closes beyond a major fractal resistance level, it may indicate increasing buying pressure and the beginning of a bullish expansion.
A break below fractal support can signal a potential bearish continuation. Setting alerts near important levels helps traders monitor opportunities without constantly watching charts.
Get Instant Free Access
Indicator Settings
- Colors: Customize the appearance of support and resistance lines, channels, and other chart elements to match your trading template.
- Alerts: Enable notifications when price reaches important fractal support or resistance areas. Available alerts can help traders react quickly when price approaches key levels.
Important Notes
- Fractal levels become more meaningful when confirmed by multiple price reactions.
- Higher timeframe support and resistance zones often have stronger market impact.
- Breakouts should be confirmed with closing price and momentum before entering.
- The indicator is designed for analysis and should be combined with proper risk management.
- Price action confirmation can improve the quality of fractal-based trade setups.









