
The Better Volume indicator for MT4 is a volume analysis tool that helps traders understand market activity and participation.
Since Forex does not provide centralized exchange volume data, the indicator uses tick volume to measure the number of price changes during a specific period.
By analyzing changes in trading activity, the Better Volume Indicator helps traders recognize periods of strong participation, low interest, and possible market turning points.
The indicator displays volume information through a colored histogram, making it easier to identify unusual activity directly on the MT4 chart.
Volume analysis can provide valuable insight into market sentiment.
When combined with trend analysis and price action, the Better Volume Indicator can help traders find higher-quality trade opportunities and avoid uncertain market conditions.
Why traders use the Better Volume Indicator for MT4
Price movement alone does not always reveal the full market picture.
A strong price move supported by increasing volume often shows greater participation, while weak volume can indicate a lack of conviction behind a move.
The Better Volume Indicator separates volume activity into different categories using colored histogram bars.
This allows traders to quickly identify unusual volume increases, quiet market periods, and moments where buyers or sellers become more active.
A useful advantage of this indicator is that it includes a moving average line inside the volume window.
This provides an additional reference point for comparing current volume activity with previous market conditions.
Download This MT4 Indicator for Free
Indicator Chart Setup
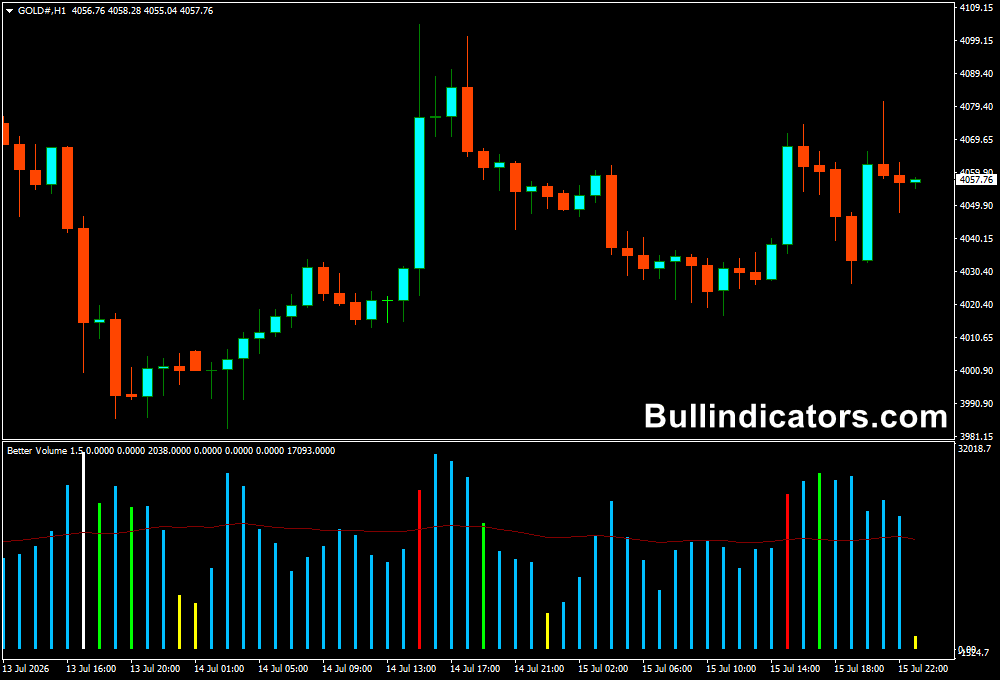
After applying the Better Volume Indicator to an MT4 chart, a colored histogram appears in a separate window below the price chart.
Each color represents a different type of volume activity.
Blue bars show standard volume conditions, yellow highlights lower activity, while green, red, and white bars indicate increased participation from market participants.
The indicator also displays a moving average line that can be used to compare current volume levels against average activity.
This helps traders recognize when market participation is increasing or decreasing.
Core Features
- Analyzes Forex tick volume activity.
- Displays volume changes through colored histogram bars.
- Identifies periods of increased market participation.
- Highlights low-volume conditions.
- Includes a volume moving average line.
- Customizable alerts and display options.
- Useful for confirming price action movements.
- Works on all MT4 timeframes.
Best for
- Analyzing market participation.
- Confirming breakout strength.
- Finding high-volume trading opportunities.
- Avoiding low-activity market conditions.
- Supporting trend-based strategies.
Best Markets
- Forex pairs with strong session activity.
- Major currency pairs such as EURUSD, GBPUSD, and USDJPY.
- Gold (XAUUSD), where volume changes often accompany strong price movements.
- Indices during active market hours.
- Markets where traders want additional confirmation of momentum.
Trading Styles
- Scalping on M5 and M15 charts by monitoring sudden volume increases.
- Intraday trading on M15, M30, and H1 timeframes to confirm momentum.
- Swing trading on H1 and H4 charts by combining volume with broader market direction.
- Breakout trading when increased volume confirms a price expansion.
- Trend-following strategies where volume supports the current market movement.
How traders use it
The Better Volume Indicator is commonly used as a confirmation tool.
When price moves in a specific direction and volume increases at the same time, traders may consider the move stronger. Low-volume movements can suggest weaker momentum and require additional confirmation.
For example, the indicator works well together with the Super Trend indicator.
The Super Trend identifies the overall market direction, while Better Volume helps confirm whether enough market participation supports the move.
When the Super Trend shows a bullish trend and the Better Volume Indicator displays increased buying activity, traders can look for possible long setups.
The same approach applies during bearish conditions when selling activity increases.
Volume signals should always be evaluated together with the overall market context.
A high-volume candle does not automatically guarantee that price will continue in the same direction, so traders should also consider price action and trend conditions before entering a position.
Get Instant Free Access
Indicator Settings
- MAPeriod: Selects the period of the moving average displayed in the indicator window.
- LookBack: Determines the number of ticks used to calculate the volume histogram.
- Width1: Controls the thickness of the histogram columns.
- AlertOnColorChange: Enables or disables notifications when volume colors change.
- IgnoreLightSeaGreen: Shows or hides light green volume bars.
- IgnoreWhite: Shows or hides white volume bars.
- IgnoreFireBrick: Shows or hides dark red volume bars.
- Notifications: Controls alert settings.
- Colors: Adjusts the appearance of the histogram.
Important Notes
- Forex volume is based on tick activity rather than centralized exchange volume.
- High-volume signals should be confirmed with market direction.
- Low-volume periods can indicate uncertainty or reduced participation.
- The indicator is most effective when combined with a complete trading strategy.
- Different markets may produce different volume characteristics.
- Use proper risk management when trading volume-based setups.









