
The Support Resistance Breakout Arrows indicator for MT4 is designed for traders who use breakout and trend-following strategies.
It automatically identifies important support and resistance levels while generating buy and sell arrows when potential breakout opportunities appear.
The indicator combines Fractals, CCI, and RSI calculations to filter market conditions and reduce weaker signals.
Instead of manually drawing support and resistance zones, traders can use the indicator to quickly locate important price areas directly on the MT4 chart.
With its non-repainting arrows and automatically updated levels, this tool can help intraday and swing traders analyze market structure, identify breakout opportunities, and manage positions during strong trends.
Why traders use the Support Resistance Breakout Arrows Indicator for MT4
Support and resistance levels are among the most widely used concepts in technical analysis.
Finding reliable levels manually can take time, especially when monitoring multiple currency pairs.
This indicator simplifies the process by automatically marking important price zones.
The combination of breakout arrows with support and resistance levels gives traders additional context before entering a trade.
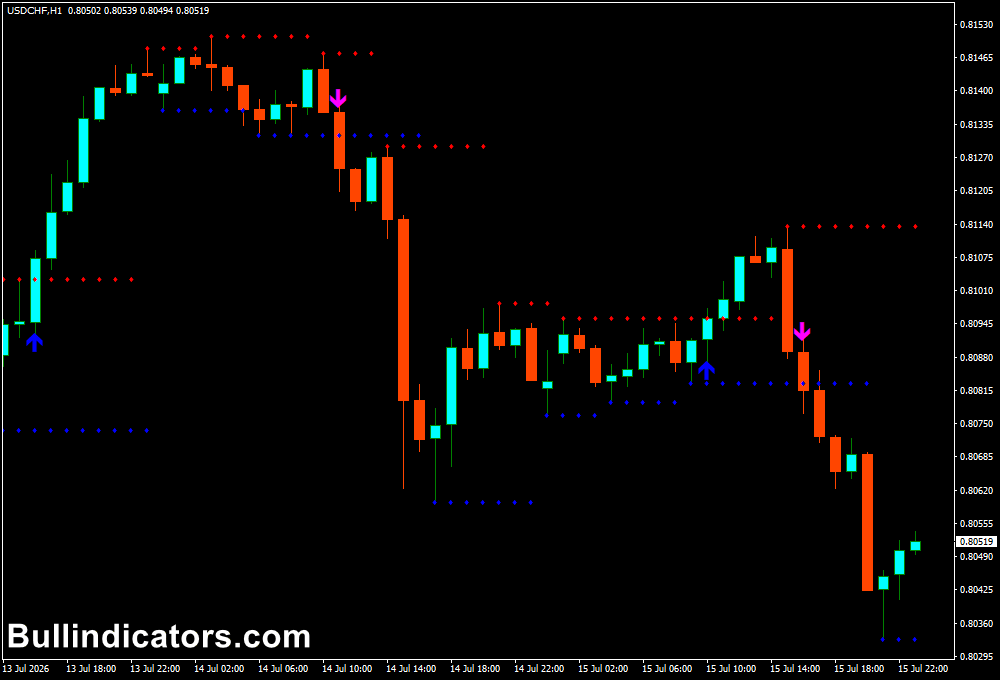
A blue arrow indicates a potential buy opportunity, while a magenta arrow highlights a possible sell setup.
Traders can then evaluate the surrounding market conditions before making a decision.
The built-in CCI and RSI filters allow users to adjust signal sensitivity.
This makes it possible to adapt the indicator for different markets, timeframes, and trading approaches.
Download This MT4 Indicator for Free
Indicator Chart Setup
After applying the indicator to an MT4 chart, automatic support and resistance levels appear together with breakout arrows.
Blue arrows represent potential buying signals, while magenta arrows highlight possible selling opportunities.
Support levels are displayed in blue and resistance levels are displayed in red.
These levels can be used to identify breakout areas, monitor trend continuation, or plan possible entry and exit zones.
The indicator does not repaint the arrows or the support and resistance lines after the signal is confirmed, allowing traders to review historical setups more accurately.
Core Features
- Automatically identifies support and resistance levels.
- Provides buy and sell breakout arrows.
- Uses Fractals, CCI, and RSI for signal filtering.
- Non-repainting signal arrows.
- Non-repainting support and resistance levels.
- Adjustable RSI and CCI filters.
- Works on all MT4 timeframes.
- Includes alert notifications.
Best for
- Breakout trading strategies.
- Support and resistance analysis.
- Intraday market scanning.
- Trend continuation setups.
- Finding potential entry points during strong price movements.
Best Markets
- Forex pairs with clear support and resistance reactions.
- Major currency pairs during active trading sessions.
- Volatile pairs where breakout movements occur frequently.
- Gold (XAUUSD) and other instruments with strong price expansions.
- Indices that often develop directional breakout moves.
Trading Styles
- Scalping on M5 and M15 charts when fast breakout signals are required.
- Intraday trading on M15, M30, and H1 timeframes using key price levels.
- Swing trading on H4 charts by following larger breakout movements.
- Position trading on Daily and Weekly charts using major support and resistance zones.
- Multi-timeframe analysis where higher timeframe levels guide lower timeframe entries.
How traders use it
The indicator is commonly applied by waiting for price to approach a key support or resistance area.
When a breakout arrow appears, traders analyze whether the move has enough momentum to continue before entering a position.
For example, a blue buy arrow appearing above a resistance zone can indicate increasing buying pressure.
Traders may look for confirmation that price is holding above the breakout area before entering.
A magenta sell arrow below support can suggest bearish momentum and a possible continuation lower.
The indicator can also be useful during strong trends.
When price continues moving in one direction, traders may use newly formed support or resistance levels as areas to monitor additional entries.
Although the indicator provides automated signals, combining the breakout information with price action and market conditions can improve trade selection.
Get Instant Free Access
Indicator Settings
- RSICCI_Filter: Enables or disables the CCI and RSI signal filter.
- RSIPeriod: Sets the calculation period for the RSI indicator.
- RSIOverbought: Defines the RSI overbought level used for filtering signals.
- RSIOversold: Defines the RSI oversold level used for filtering signals.
- CCIPeriod: Sets the calculation period for the CCI indicator.
- CCIBuyLevel: Determines the CCI level required for buy signals.
- CCISellLevel: Determines the CCI level required for sell signals.
- HighLow: Provides alerts when previous highs or lows are broken.
- Push Alerts: Enables mobile notifications.
- Colors: Adjusts the appearance of arrows and levels.
Important Notes
- The indicator is designed for breakout and support/resistance analysis.
- False breakouts can occur during sideways markets.
- Higher timeframe signals generally contain less market noise.
- Adjust RSI and CCI settings according to the market being traded.
- Always use proper risk management when trading breakout setups.
- Confirm important breakouts with overall market conditions before entering.









