
The Gimat Trend Reversal indicator for MT4 is a trend reversal tool that identifies potential market turning points using a ZigZag-based calculation.
It scans price movements to locate important highs and lows, then places arrows on the chart when a possible change in market direction occurs.
Trend reversals often provide some of the best trading opportunities, but finding the exact moment when momentum changes can be challenging.
The Gimat Reversal Indicator helps simplify this process by highlighting possible bullish and bearish reversal areas directly on the MT4 chart.
The indicator is suitable for traders who follow swing movements, trend changes, and price reversal setups.
It can be applied across different timeframes and combined with additional technical analysis methods for confirmation.
Why traders use the Gimat Trend Reversal Indicator for MT4
Recognizing market tops and bottoms is an important part of technical analysis.
The Gimat Trend Reversal Indicator automatically searches for significant price turning points, allowing traders to focus on possible trend changes without manually analyzing every swing.
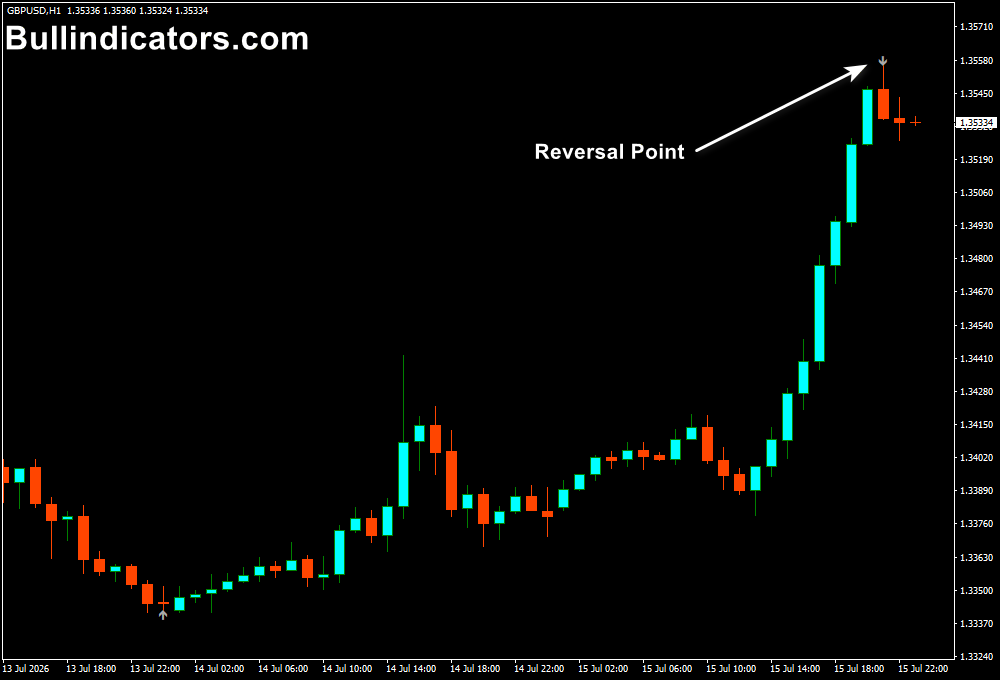
When a bullish reversal is detected, the indicator places an upward arrow on the chart. A downward arrow appears when bearish momentum develops.
These signals can help traders identify possible entry areas and manage existing positions during changing market conditions.
The indicator is especially useful for traders who prefer following larger price swings.
By highlighting reversal points, it can help capture more of the trend movement rather than entering after a large part of the move has already occurred.
Download This MT4 Indicator for Free
Indicator Chart Setup
After attaching the indicator to an MT4 chart, arrows appear when the calculation identifies a possible trend reversal point.
A buy arrow indicates a potential bullish change, while a sell arrow suggests possible bearish pressure.
The indicator analyzes previous price highs and lows using adjustable parameters.
These settings control how sensitive the indicator is when searching for reversal zones.
Higher values create fewer signals by filtering smaller price movements, while lower values produce more frequent signals.
Core Features
- Identifies potential trend reversal points.
- Uses ZigZag-based swing analysis.
- Displays buy and sell arrows directly on the chart.
- Helps identify market tops and bottoms.
- Adjustable sensitivity settings.
- Suitable for swing and intraday trading.
- Works on multiple MT4 timeframes.
- Customizable line width and colors.
Best for
- Trend reversal analysis.
- Swing trading strategies.
- Finding possible market turning points.
- Trend continuation after pullbacks.
- Combining reversal signals with price action analysis.
Best Markets
- Forex pairs with clear swing movements.
- Major currency pairs on higher timeframes.
- Gold (XAUUSD), where larger price swings create reversal opportunities.
- Indices with strong directional movements.
- Markets where traders focus on identifying trend changes.
Trading Styles
- Scalping on M5 and M15 charts using shorter reversal movements.
- Intraday trading on M15, M30, and H1 timeframes.
- Swing trading on H1 and H4 charts by following larger market swings.
- Position trading on Daily charts to capture major trend reversals.
- Multi-timeframe analysis where higher timeframe signals provide additional context.
How traders use it
The Gimat Trend Reversal Indicator is commonly used by waiting for an arrow signal and then evaluating the surrounding market conditions.
A buy arrow can indicate that sellers may be losing control and buyers are gaining strength. A sell arrow suggests that upward momentum may be weakening.
A common trade management method is placing a stop loss beyond the previous swing point.
For example, after a buy signal, traders may place the stop loss below the recent swing low.
The opposite reversal arrow can be monitored as a possible exit signal.
The indicator can also be combined with other technical analysis tools to improve trade selection.
Since reversal indicators can occasionally identify turning points after the move has already started, confirmation through price action, market structure, or trend analysis can help filter weaker signals.
Get Instant Free Access
Indicator Settings
- ExtDepth: Determines the number of candles analyzed when searching for significant highs and lows.
- ExtDeviation: Sets the minimum pip distance required between price extremes before a new reversal point is recognized.
- Line Width: Adjusts the thickness of the indicator display.
- Colors: Changes the appearance of reversal signals and chart elements.
Important Notes
- The indicator is designed to identify potential reversal areas, not guarantee market direction.
- The latest signal may change as new price data develops.
- Higher ExtDepth settings create fewer but larger swing signals.
- Lower settings create more frequent signals with increased sensitivity.
- Best results often come from combining reversal signals with additional confirmation.
- Use appropriate risk management when trading reversal setups.









