
The Accurate Supply and Demand Zones indicator for MT4 is designed to help traders identify important areas where buying and selling pressure may increase.
These zones represent locations on the chart where institutional activity and strong price reactions have previously occurred.
The indicator automatically detects potential supply and demand areas and displays them directly on the MetaTrader 4 chart.
This allows traders to quickly locate possible reversal zones, plan entries, and combine the information with price action analysis for more accurate trading decisions.
Why traders use the Accurate Supply and Demand Zones Indicator
Supply and demand trading is widely used because markets often react around areas where strong buying or selling interest exists.
Unlike traditional support and resistance lines, zones provide a broader price area where multiple orders may be concentrated.
Traders use the Supply and Demand Zones Indicator to save time when searching for these areas manually.
The indicator highlights possible demand zones where buyers may step in and supply zones where sellers may take control.
This makes it easier to analyze charts and prepare trading setups.
The indicator is useful for both beginners learning zone-based trading and experienced traders who want a faster way to locate important market areas.
Download This MT4 Indicator for Free
Indicator Chart Setup
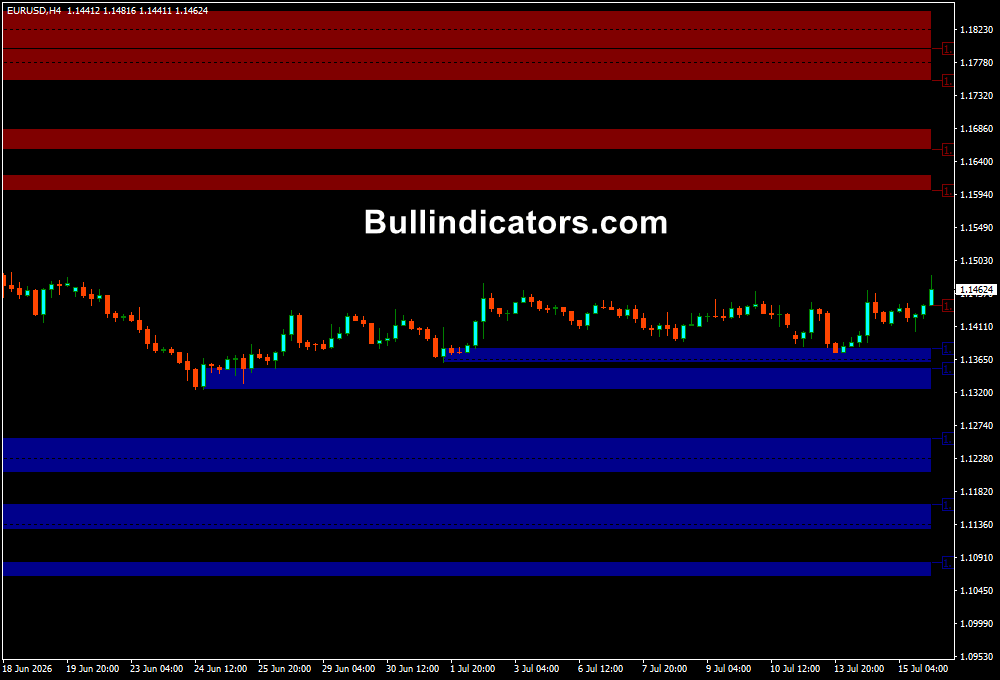
After applying the Accurate Supply and Demand Zones Indicator to a MetaTrader 4 chart, traders will see automatically drawn colored zones representing possible areas of market interest.
Demand areas identify potential buying locations, while supply areas show possible selling pressure.
The indicator can display zones from the current timeframe or from another timeframe, allowing traders to analyze higher timeframe areas while trading on lower timeframe charts.
This is especially useful for intraday traders who want to combine short-term entries with larger market zones.
Core Features
- Automatically detects supply and demand zones on MT4 charts
- Displays potential buying and selling areas visually
- Supports multi-timeframe zone analysis
- Allows traders to adjust zone width and appearance
- Helps identify possible reversal and continuation areas
- Works with price action and other trading strategies
Best for
- Finding potential reversal zones
- Planning entry points around strong market areas
- Combining supply and demand with price action confirmation
- Analyzing higher timeframe market conditions
- Building intraday and swing trading strategies
Best Markets
- Major forex pairs such as EUR/USD, GBP/USD, and USD/JPY
- Cross pairs with strong price movements like GBP/JPY
- Gold (XAU/USD) where supply and demand reactions are often visible
- Major indices such as NASDAQ and DAX for zone-based analysis
- Cryptocurrency markets with strong support and resistance reactions
Trading Styles
- Day trading using M15 and H1 supply and demand zones
- Swing trading based on higher timeframe market areas
- Price action trading with candlestick confirmation
- Trend continuation strategies using pullbacks into zones
- Scalping when combined with lower timeframe confirmation signals
How traders use it
Traders usually begin by identifying the strongest supply and demand zones on the chart.
When price approaches a demand zone, traders look for buying opportunities if there are signs of bullish momentum.
When price reaches a supply zone, traders watch for selling opportunities and possible bearish reactions.
A common approach is to use higher timeframe zones because they often represent stronger market interest.
For example, a trader can display H1 supply and demand zones while entering trades on an M15 chart. This provides a broader market view while allowing precise entries.
Stop loss placement is normally positioned outside the zone area.
Many Forex traders place buy trade protection below demand zones and sell trade protection above supply zones.
Profit targets can be based on the next opposing zone or a predefined risk-to-reward ratio.
Get Instant Free Access
Indicator Settings
- ForcedTF: Selects the timeframe used for drawing zones. Value 0 uses the current chart timeframe.
- Other timeframe values: Displays supply and demand zones from the selected timeframe on the current chart.
- UseNarrowBands: Reduces the width of displayed zones for more precise areas.
- KillRetouch: Redraws zones after price touches an existing supply or demand area.
- Colors: Allows customization of zone appearance.
- Line Style: Adjusts the visual style of displayed zones.
Important Notes
- Supply and demand zones should always be confirmed with additional price action analysis.
- A zone can fail when market momentum is strong and price breaks through the area.
- Higher timeframe zones are generally considered more significant than lower timeframe zones.
- The indicator identifies possible areas of interest but does not guarantee market reversals.
- Combining zones with risk management helps improve long-term trading consistency.









