
The MTF High Low Price indicator for MT4 is a multi-timeframe analysis tool that displays important price levels from different market periods.
It automatically plots previous and current daily, weekly, and monthly high and low levels together with pivot lines directly on the chart.
Understanding higher timeframe price levels can help traders identify important areas where the market may react.
Previous highs, lows, and pivot points often act as reference zones for entries, exits, breakouts, and trend analysis.
The indicator also creates visual rectangles that represent daily, weekly, and monthly market areas.
This makes it easier to compare price behavior across multiple timeframes while trading from a single MT4 chart.
Why traders use the MTF High Low Price Indicator for MT4
Multi-timeframe analysis is an important part of many trading strategies.
A price level that looks insignificant on a lower timeframe can become a major area when viewed from a daily, weekly, or monthly perspective.
The MTF High Low Price Indicator saves time by automatically displaying these important levels.
Traders can quickly see where previous market highs and lows occurred and use this information when planning their next trade.
The indicator is also useful for identifying market direction.
When price remains above important higher timeframe levels, it may indicate stronger bullish conditions.
When price trades below these areas, it can suggest increasing bearish pressure.
By combining high and low levels with pivot lines and market zones, traders receive a complete overview of price structure without switching between multiple charts.
Download This MT4 Indicator for Free
Indicator Chart Setup
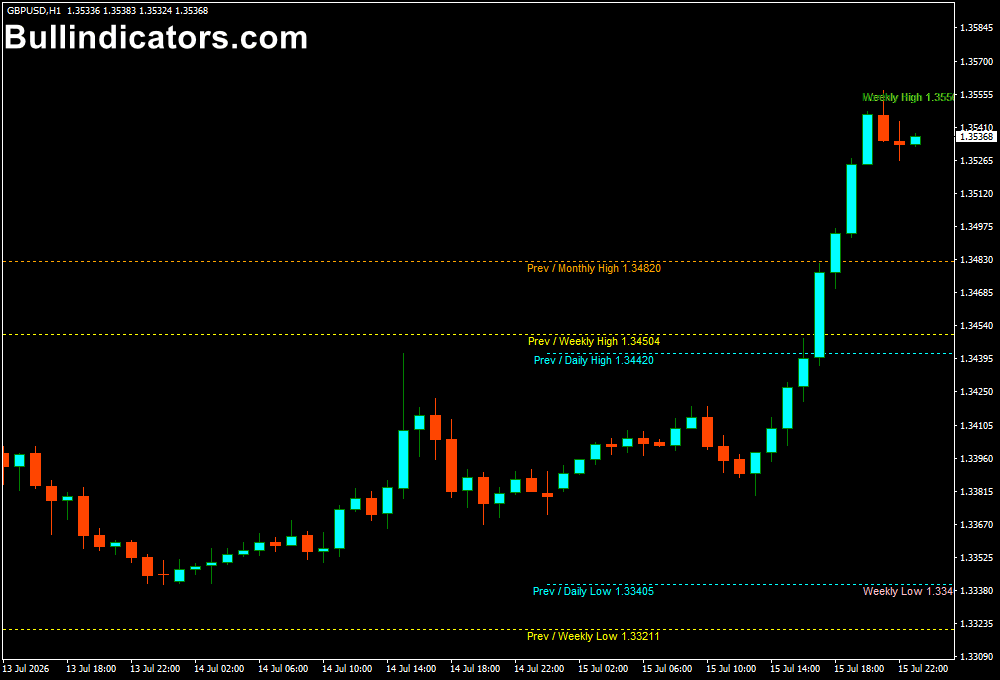
After applying the indicator to an MT4 chart, traders can see previous daily, weekly, and monthly high and low levels displayed as horizontal lines.
Daily, weekly, and monthly pivot levels can also be added depending on the selected settings.
The chart rectangles highlight different market periods, helping traders visualize how price moves within larger timeframe ranges.
This can be useful when looking for breakout opportunities or areas where price may reverse.
The indicator works on all MT4 timeframes, allowing traders to use lower timeframe charts while still keeping important higher timeframe information visible.
Core Features
- Displays daily, weekly, and monthly high and low levels.
- Shows previous market period price zones.
- Includes daily, weekly, and monthly pivot lines.
- Creates visual timeframe rectangles on the chart.
- Supports multi-timeframe market analysis.
- Helps identify potential support and resistance areas.
- Works on all MT4 chart timeframes.
- Fully customizable colors and display options.
Best for
- Multi-timeframe technical analysis.
- Support and resistance trading.
- Breakout strategies.
- Intraday entry and exit planning.
- Identifying important market reaction zones.
Best Markets
- Major Forex pairs where previous highs and lows are widely respected.
- Gold (XAUUSD) and commodities with strong intraday movements.
- Indices that often react around previous session levels.
- Currency pairs during London and New York trading sessions.
- Markets where higher timeframe levels influence short-term price action.
Trading Styles
- Scalping on M5 and M15 charts by using higher timeframe levels as entry zones.
- Intraday trading on M15, M30, and H1 charts with daily levels as reference points.
- Swing trading on H4 charts using weekly and monthly price areas.
- Position trading on Daily charts by monitoring long-term market zones.
- Breakout trading when price moves beyond previous highs or lows.
How traders use it
The MTF High Low Price Indicator is commonly used by traders who want to keep higher timeframe information visible while analyzing lower timeframe setups.
For example, an intraday trader may use the daily high and low levels to identify possible breakout areas.
If price approaches a previous daily high and breaks through with strong momentum, the level may become an area to monitor for continuation.
If price rejects the level, it may provide a possible reversal opportunity.
The pivot lines can also help traders identify potential market balance areas.
Price trading above daily or weekly pivots may indicate stronger buying pressure, while price below these levels can show increased selling activity.
The indicator works well as part of a larger trading strategy.
Combining these levels with price action, trend analysis, or other confirmation methods can help traders make more informed decisions.
Get Instant Free Access
Indicator Settings
- Show_PreviousDaily: Displays the previous day’s high and low levels.
- Xtend_Prev_DailyLine: Extends previous daily high and low lines further across the chart.
- Show_PreviousWeekly: Displays previous weekly high and low levels.
- Xtend_Prev_WeeklyLine: Extends previous weekly levels.
- Show_PreviousMonthly: Displays previous monthly high and low levels.
- Xtend_Prev_MonthlyLine: Extends previous monthly levels across the chart.
- Line Colors: Adjusts the colors of daily, weekly, and monthly levels.
- PreviousLine_Style: Changes the appearance of the level lines.
- Shift_Prev_LABEL: Moves level labels further on the chart.
- Show_CurrRectangles_Display: Enables current timeframe rectangles.
- Show_Daily_Rectangle: Displays daily market areas.
- Show_Weekly_Rectangle: Displays weekly market areas.
- Show_Monthly_Rectangle: Displays monthly market areas.
- Show_Daily_Pivots: Displays daily pivot levels.
- Show_Weekly_Pivots: Displays weekly pivot levels.
- Show_Monthly_Pivots: Displays monthly pivot levels.
- Pivot Colors and Line Width: Customizes the appearance of pivot levels.
Important Notes
- Higher timeframe levels can provide stronger market reference points.
- The indicator shows important price areas but does not predict future movements.
- Different markets may react differently to previous highs and lows.
- Use additional analysis before entering trades around key levels.
- Adjust displayed periods according to your trading style.
- Always apply proper risk management when trading with support and resistance zones.









